


DEVELOPMENT AND VALIDATION OF RP-HPLC METHOD FOR DETERMINATION OF LEVAMISOLE IN PURE AND DOSAGE FORM
HTML Full TextDEVELOPMENT AND VALIDATION OF RP-HPLC METHOD FOR DETERMINATION OF LEVAMISOLE IN PURE AND DOSAGE FORM
T. Rattaiah Gupta * 1, Brahmaiah Bonthagarala 1, A. Lakshmi Harini 1, Sk. Arifun 1, V. Prathusha 1 and G. Devala Rao 2
Department of Pharmaceutical Analysis 1, SIMS College of Pharmacy, SIMS Group of Institutions, Mangaldas Nagar, Guntur - 522001, Andhra Pradesh, India.
KVSR Siddhartha College of Pharmaceutical Sciences 2, Pinnamineni Polyclinic Road, Vijayawada - 520008, Andhra Pradesh, India.
ABSTRACT: A reverse phase isocratic HPLC was developed and validated for the determination of levamisole in pure and tablet dosage forms. Method development was carried out on YMC C18 isocratic column, (250 mm × 4.6 mm i.d., particle size 5 μm, maintained at ambient temperature), Shimadzu LC–sol 2010 Prominence Liquid Chromatography. The mobile phase was a mixture of Acetonitrile: methanol 50:50 v/v and the flow rate was set at 1.3 ml/min and UV detection at 236 nm. Validation parameters were evaluated for the method according to the ICH guidelines. In the linearity study, linearity was observed from 2-10 μg/ml with a correlation coefficient of 0.9999 and regression coefficient of 0.999. The limit of detection and limit of quantitation for the method were 0.0209μg/ml and 0.069μg/ml, respectively. The statistical analysis shows that the method was found to be accurate, reliable, simple, and reproducible. The intra and interassay precisions were satisfactory; the values of relative standard deviations did not exceed 2%. The accuracy of the method was proved; the recovery of levamisole was within limits. The chromatographic retention time of the proposed method was 3.3 min, and the assay of content was found to be 98.9%-100.8%. The proposed method was successfully applied for the quantitative determination of levamisole in pure form and could be used for routine analysis with phenomenal accuracy and precisions.
Keywords: RP-HPLC, Levamisole, Validation, ICH guidelines
INTRODUCTION: Levamisole(LMS) is (S)-6-Phenyl-2,3,5,6 - tetrahydroimidazo[2,1 - b] [1,3] thiazole Fig. 1. LMS is a pharmaceutical with anthelminthic and immunomodulatory properties 1 that was previously used in both animals and humans to treat inflammatory conditions and cancer.
LMS is the levorotatory isomer of tetramisole. Levamisole has been used in humans to treat parasitic worm infections and has been studied in combination with other forms of chemotherapy for colon cancer, melanoma, and head and neck cancer 1, 2, 3.
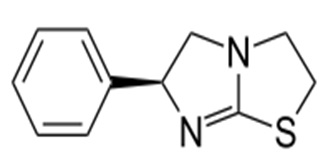
FIG. 1: STRUCTURE OF LEVAMISOLE
Literature survey reveals few analytical methods were reported for the determination of LMS in pure and pharmaceutical preparations and biological fluids by spectrophotometry 2, High-Performance Liquid Chromatography 3, 4, 5, 6. However, most of the available methods have limitations such as long runtimes, low sensitivity, uneconomical, and have poor symmetry. Keeping given these, an attempt has been made to develop a simple, accurate, precise, and reliable RP-HPLC method for the estimation of levamisole in pharmaceutical dosage forms. The established method was validated concerning specificity, linearity, precision, accuracy, robustness, LOD, and LOQ according to ICH guidelines (ICH, 1997) 7, 8, 9, 10.
MATERIALS AND METHODS: Chemicals and Reagents an analytically pure sample of LMS standard was procured as a gift sample from Cipla Ltd., Mumbai, India. All the chemicals were analytical grade. HPLC grade acetonitrile and water used were of HPLC grade and purchased from Merck Specialties Private Ltd., Mumbai, India. Commercial tablets of LMS formulation was procured from a local pharmacy. LEVOMOL tablets containing LMS with labeled amount of50mg per pill are manufactured by Cipla Ltd., Mumbai, India.
Instruments and Chromatographic Conditions: The HPLC analysis was performed on Shimadzu LC-sol2010 Prominence Liquid Chromatography YMC C18 column (4.6 mm × 250 mm, 5-micron particle size). A manually operating Rheodyne injector with 20 μL sample loop was equipped with the HPLC system. The HPLC system was equipped with data N2000 software. The mobile phase consists of a mixture of acetonitrile and methanol in a ratio of 50:50% v/v. The mobile phase was set at a flow rate of 1.3 mL/min. Elute was monitored at 236 nm.
Preparation of Reagents and Standards:
Mobile Phase: The mobile phase was prepared by mixing of acetonitrile and methanol (all of HPLC grade) in the ratio of 50:50, v/v. It is filtered through a 0.45 μm nylon membrane filter and then sonicated for degassing. Stock and Working Standard Solutions Accurately 10 mg of LMS was weighed and transferred to a 10 mL clean, dry volumetric flask, and mobile phase was added and sonicated to dissolve. The volume was made up to the mark with the mobile phase. This is standard stock solution of LMS with a concentration of 1000 μg/mL. Prepare five standard working solutions for calibration by adding defined volumes of the stock standard solution and diluting with the mobile phase. The concentrations of LMS are 2, 4, 6, 8 & 10 μg/mL respectively.
Tablet Sample Preparation: Weigh accurately not less than 20 tablets of LMS and determine average weight. Grind the tablets of LMS (LEVOMOL) into a fine powder. Weigh accurately an amount of tablet powder equivalent to 50 mg of LMS and transfer into 50 mL volumetric flask. Add 40 mL mobile phase and place in an ultra-sonication bath until dissolution is complete. Add mobile phase to bring up the volume to 50 mL. Pipette out 1.0 mL of the sample solution into a 10 mL volumetric flask and dilute with mobile phase up to the mark. Mix well. The resulting solution was filtered using a 0.2 μm filter and degassed by sonication. The resulting solution is further diluted to give a concentration of approximately 20μg/mL.
Selection of Detection Wavelength: The UV spectrum of diluted solutions of various concentrations of LMS in the mobile phase was recorded using UV spectrophotometer. The wavelength of the maximum absorbance was observed at 236 nm. This wavelength was used for the detection of LMS.
Calibration Curve for Levamisole: 20 μl of each calibration standard solutions (2, 4, 6, 8, & 10 μg/mL) were injected into the HPLC system to get the chromatograms. The average peak area and retention time were recorded. Linearity curve was constructed by plotting concentration of LMS on X-axis and average peak areas of standard LMS on Y-axis and regression equations were computed for LMS. The linearity range was found to be 2-10 μg/mL. The results were presented in Table 1. The standard chromatogram of LMS calibration standard has been depicted in Fig. 2.
Results show that a phenomenal correlation exists between peak area and concentration of drug within the linearity range. The regression graph for LMS is presented in Fig. 3. The data of the analysis is presented in Table 2.
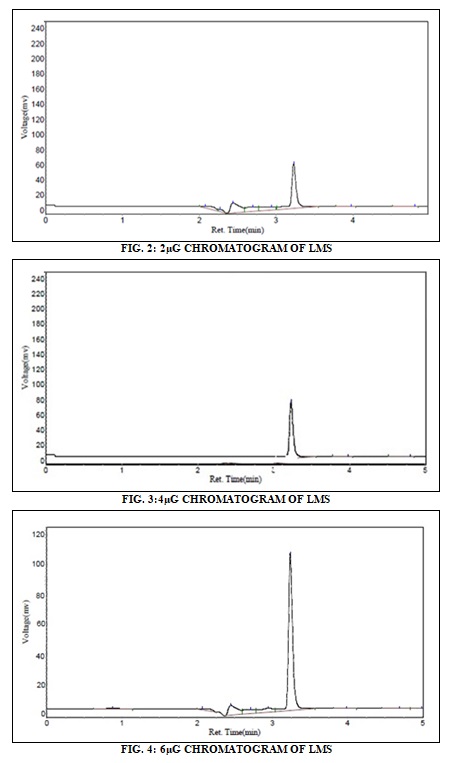
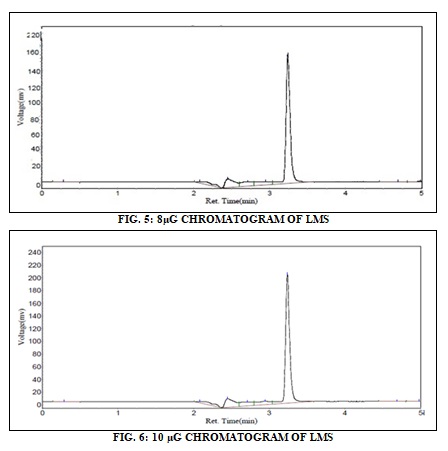
TABLE 1: LINEARITY
| Concentration of levamisole(μg/ml) | Levamisole Peak Area (mV.sec) |
| 2 | 721081 |
| 4 | 1446122 |
| 6 | 2181720 |
| 8 | 2884324 |
| 10 | 3624987 |
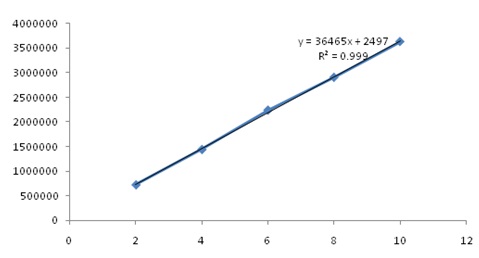
FIG. 7: LINEARITY GRAPH
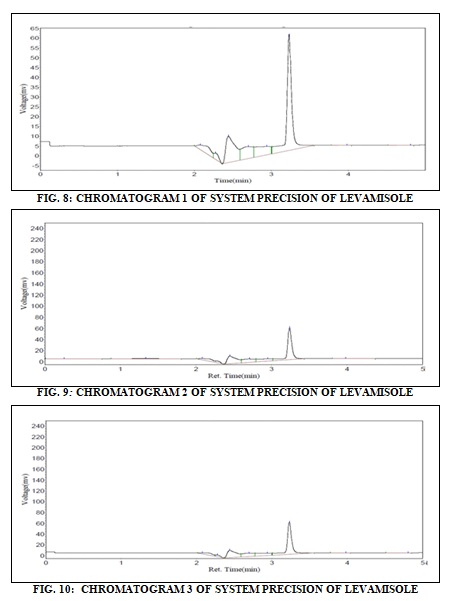
System Precision:
TABLE 2: SYSTEM PRECISION
| S. no. | Retention time | Peak area |
| 1 | 3.313 | 723061 |
| 2 | 3.323 | 721081 |
| 3 | 3.357 | 727240 |
| 4 | 3.357 | 723262 |
| 5 | 3.348 | 713262 |
| mean | 3.3396 | 721581.2 |
| Sd | 0.0203 | 5159.84 |
| %RSD | 0.609 | 0.715 |
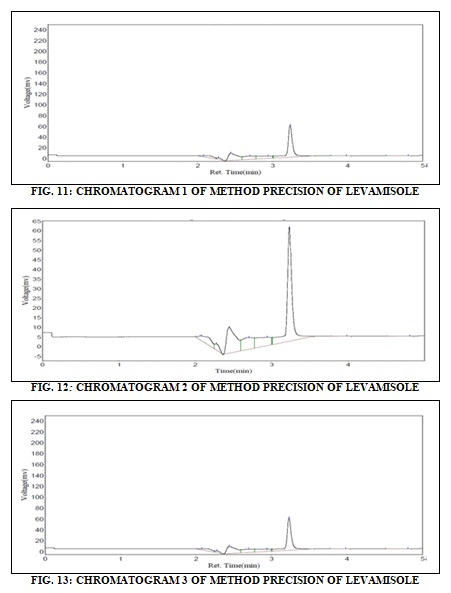
Method Precision:
TABLE 3: METHOD PRECISION
| S. no. | Levamisole | |
| Area | % Labelled Claim | |
| 1 | 723061 | 100.20 |
| 2 | 721081 | 99.93 |
| 3 | 727240 | 100.784 |
| 4 | 723262 | 100.232 |
| 5 | 713262 | 98.847 |
| Mean | 721581.2 | 100.007 |
| S.D | 5159.85 | 0.71507 |
| %RSD | 0.71507 | 0.71507 |
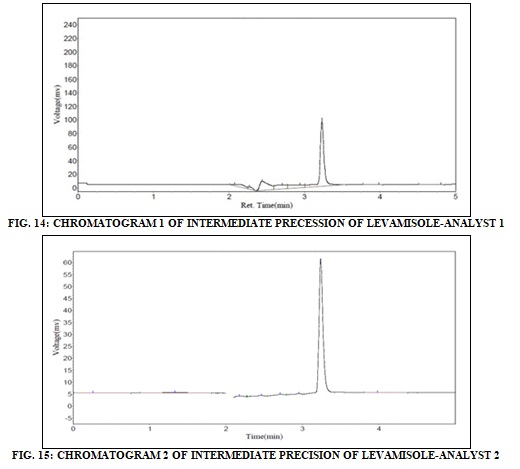
Intermediate Precision:
TABLE 4: INTERMEDIATE PRECESSION
|
Levamisole |
S. no. | ANALYST – 1 | ANALYST – 2 | ||
| Area (Mv.sec) | Retention time | Area (Mv.sec) | Retention time | ||
| 1 | 723061 | 3.309 | 723061 | 3.313 | |
| 2 | 721081 | 3.323 | 721081 | 3.323 | |
| 3 | 727240 | 3.317 | 727240 | 3.357 | |
| 4 | 723262 | 3.327 | 723262 | 3.357 | |
| 5 | 717262 | 3.338 | 717262 | 3.348 | |
| MEAN | 721581.2 | 3.3228 | 721581.2 | 3.3396 | |
| S.D | 5159.8498 | 0.010872 | 5159.8498 | 0.0203 | |
| % RSD | 0.71507543 | 0.327193 | 0.71507543 | 0.6098 | |
Accuracy:
Results for Recovery Studies:
TABLE 5: LEVEL 2(50%) OF ACCURACY OF LEVAMISOLE.
| Standard | Level | Amt added (mg) | Total amt recovery | Recovered | % Recovered |
| 4 | 2 | 2 | 6.02 | 2.02 | 101 |
| 4 | 2 | 2 | 5.95 | 1.95 | 97.5 |
| 4 | 2 | 2 | 5.92 | 1.92 | 96 |
| 4 | 2 | 2 | 5.9 | 1.9 | 95 |
| 4 | 2 | 2 | 6.01 | 2.01 | 100.5 |
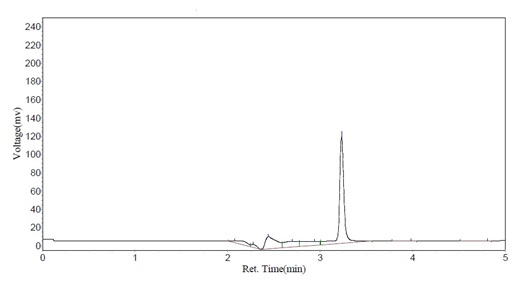
FIG. 16: CHROMATOGRAM OF ACCURACY OF LEVAMISOLE STANDARD (4μg/ml) + LEVAMISOLETEST (2μg/ml)
TABLE 6: LEVEL 4(100%) OF ACCURACY OF LEVAMISOLE
| Standard | Level | Amt added (mg) | Total amt recovery (mg) | Recovered (mg) | % Recovered |
| 4 | 4 | 4 | 8.05 | 4.02 | 100.5 |
| 4 | 4 | 4 | 7.92 | 3.92 | 98 |
| 4 | 4 | 4 | 8.19 | 4.19 | 104.75 |
| 4 | 4 | 4 | 7.85 | 3.85 | 96.25 |
| 4 | 4 | 4 | 7.96 | 3.96 | 99 |
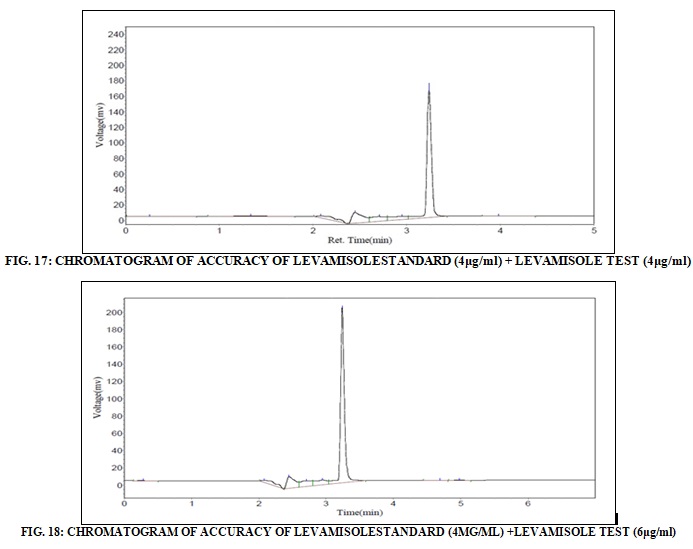
TABLE 7: LEVEL 6(150%) OF ACCURACY OF LEVAMISOLE
| Standard | Level | Amt added (mg) | Total amt recovery (mg) | Recovered (mg) | % Recovered |
| 4 | 6 | 6 | 10.09 | 6.02 | 100.5 |
| 4 | 6 | 6 | 9.92 | 5.92 | 98.66 |
| 4 | 6 | 6 | 9.89 | 5.89 | 98.16 |
| 4 | 6 | 6 | 10.12 | 6.12 | 102 |
| 4 | 6 | 6 | 9.95 | 5.95 | 99.16 |
Assay of Levamisole Tablets: The developed method was applied to the assay of LMS tablets. The drug content was calculated as an average of six determinations, and assay results were shown within limits. The results were very close to the labeled value of commercial tablets.
TABLE 8: DATA OF ANALYSIS
| Parameters | Levamisole | |
| Linearity range | 2-10 (µgml) | |
| Regression equation | y = 364654x + 2497 | |
| slope | 364654 | |
| Intercept | 2497 | |
| Correlation coefficient | 0.999 | |
| System precision (% RSD) | 0.609 | |
| Method precision (% RSD) | 0.715 | |
| Intermediate precision | Analyst-I | 0.327 |
| Analyst-II | 0.609 | |
| % Recovery | Leve-2(50%) | 95-101 |
| Level-4(100%) | 96.25-104.75 | |
| Level-6(150%) | 98.16-102 | |
| LOD | 0.0209 µg/ml | |
| LOQ | 0.069 µg/ml | |
| % Assay | 98.9%-100.8%. | |
RESULTS AND DISCUSSION: The present study was aimed at developing a precise, sensitive, rapid, and accurate HPLC method for the analysis of LMS in pure drug and pharmaceutical dosage forms. To achieve phenomenal retention time and peak asymmetry, a C18 stationary phase column (250mm × 4.6mm, 5 μm particle size) and mobile phase composed of acetonitrile and methanol in a ratio of 50:50 v/v, at a flow rate of 1.3mL/min, was selected. The retention time for LMS was found to be 6.5 min. UV spectra of LMS showed that the drug absorbed maximum at 236 nm, so this wavelength was selected as the detection wavelength. The correlation coefficient (0.9999) of regression was found almost equal to1 in the range of 2-10 μg/mL, which states that the method was linear to the concentration versus peak area responses. On slight variation in the mobile phase ratio of up to ±5%, the change in the peak asymmetry, plate count and retention time are within the limits which indicated that the method is robust and also indicating lack of influence on the test results by operational variable for the proposed method.
This shows that the method has phenomenal system suitability parameters under given conditions. The comparison of chromatograms of Placebo, standard, and sample, there was no interference observed from the peaks of placebo, standard, and sample. The accuracy of the method was found to be good with the overall % RSD for recovery at 50%, 100% and 150% levels were all within limits. This indicates that the proposed method was found to be accurate. Method validation following ICH guidelines indicated that the developed method had high sensitivity with LOD of 0.0209 μg/mL and LOQ of 0.069 μg/mL. The assay results of tablets by applying the HPLC method was found to be within the pharmacopoeial limits, and the assay values were found to be 98.9%-100.8%.
CONCLUSION: The developed RP-HPLC method for the quantification of LMS has various advantages like less retention time, good peak symmetry and phenomenal linearity, highly sensitive, simple, precise, accurate and robust. The mobile phase can be easily prepared and diluent is economical and readily available and it does not need sample preparation with sophisticated techniques or instruments. These attribute the high quality of the method. The proposed method can be used for the routine analysis of LMS in pure preparations of the drug and in pharmaceutical dosage forms for routine application in quality control laboratories without the interference of excipients.
ACKNOWLEDGEMENT: Nil
CONFLICT OF INTEREST: Nil
REFERENCES:
- Drug today medical journal, Lorina publication (India) Inc., Delhi-91, 2012; 1: 588.
- El-Didamony AM: Spectrophotometric determination of benzydamine HCl, levamisole HCl and mebeverineHCl through ion-pair complex formation with methyl range. Spectrochimica Acta Part A: Molecular and Biomolecular Spectroscopy 2008; 69(3): 770-75.
- Garcia JJ, Diez MJ, Sierra M and Terán MT: Determination of levamisole by HPLC in plasma samples in the presence of heparin and pentobarbital. Journal of Liquid Chromatography 1990; 13(4): 743-49.
- DeBukanski BW, Degroodt JM and Beernaert H: Determination of levamisole and thiabendazole in meat by HPLC and photodiode array detection. Zeitschriftfür Lebensmittel- Untersuchung und Forschung 1991; 193(6): 545-47.
- Marriner S, Galbraith EA and Bogan JA: Determination of the anthelmintic levamisole in plasma and gastrointestinal fluids by high-performance liquid chromatography. Analyst 1980; 105(1255): 993-96.
- Vandamme TF, Demoustier M and Rollmann B: Quantitation of levamisole in plasma using high-performance liquid chromatography. European Journal of Drug Metabolism and Pharmacokinetics 1995; 20(2): 145-49.
- Sari P, Sun J, Razzak M and Tucker IG: HPLC assay of levamisole and abamectin in sheep plasma for application to pharmacokinetic studies. Journal of Liquid Chromatography & Related Technologies 2006; 29(15): 2277-90.
- Du Preez JL and Lötter AP: Solid phase extraction and HPLC determination of levamisole hydrochloride in sheep plasma. The Onderstepoort Journal of Veterinary Research 1996; 63(3): 209.
- Sari P, Razzak M and Tucker IG: Rapid, simultaneous determination of levamisole and abamectin in liquid formulations using HPLC. Journal of Liquid Chromatography & Related Technologies 2005; 27(2): 351-64.
- Cannavan A, Blanch flower WJ and Kennedy DG: Determination of levamisole in animal tissues using liquid chromatography-thermospray mass spectrometry. Analyst 1995; 120(2): 331-33.
- Chappell CG, Creaser CS, Stygall JW and Shepherd MJ: On‐line high‐performance liquid chromatographic/gas chromatographic/tandem ion trap mass spectrometric determination of levamisole in milk. Biological Mass Spectrometry 1992; 21(12): 688-92.
- ICH, Harmonized Tripartite Guideline. Validation of Analytical Procedure: Methodology (Q2B). International Conference on Harmonization.
- Development and Validation of RP-HPLC Method For Determination of levamisole in bulk and dosage form P. Ravisankar, G. Devala Rao, Asian Journal of Pharmaceutical & Clinical Research 2013; 169.
How to cite this article:
Gupta TR, Bonthagarala B, Harini AL, Arifun Sk, Prathusha V and Rao GD: Development and validation of RP-HPLC method for determination of levamisole in pure and dosage form. Int J Life Sci & Rev 2015; 1(5): 189-98. doi: 10.13040/IJPSR.0975-8232.IJLSR. 1(5).189-98.
All © 2015 are reserved by International Journal of Life Sciences and Review. This Journal licensed under a Creative Commons Attribution-NonCommercial-ShareAlike 3.0 Unported License.
Article Information
5
189-198
1146
2248
English
IJP
T. R. Gupta *, B. Bonthagarala, A. L. Harini, S. Arifun, V. Prathusha and G. D. Rao
Department of Pharmaceutical Analysis, SIMS College of Pharmacy, SIMS Group of Institutions, Mangaldas Nagar, Guntur, Andhra Pradesh, India.
rattaiahgupta@gmail.com
20 February 2015
27 March 2015
28 April 2015
10.13040/IJPSR.0975-8232.IJLSR.1(5).189-98
01 May 2015