


STABILITY INDICATING HIGH-PERFORMANCE THIN-LAYER CHROMATOGRAPHY FOR CARVEDILOL IN BULK DRUG AND IN SOLID LIPID NANOPARTICLES
HTML Full TextSTABILITY INDICATING HIGH-PERFORMANCE THIN-LAYER CHROMATOGRAPHY FOR CARVEDILOL IN BULK DRUG AND IN SOLID LIPID NANOPARTICLES
Mohammad Shah Faisal * 1, Zrien Naz 1, Mustafa Sawan 1, Md. Habban Akhter 2, Javed Ali 2, Faiyaz Shakeel 3 and Sanjula Baboota 2
Department of Pharmaceutics 1, College of Pharmacy, Al-Asmarya University, Zliten, Libya.
Department of Pharmaceutics 2, Faculty of Pharmacy, Jamia Hamdard, New Delhi - 110062, Delhi, India.
Department of Pharmaceutics 3, Centre of Excellence in Biotechnology Research, College of Pharmacy, King Saud University, Riyadh, Saudi Arabia.
ABSTRACT: A stability-indicating High-Performance Thin-Layer Chromatographic method (HPTLC) was developed and validated as per the International Conference on Harmonization (ICH) guidelines for determination of carvedilol (CRL) both in bulk drug and solid lipid nanoparticles (SLNs). The solvent system comprised of toluene–chloroform-methanol-acetic acid (2.0:2.0:1.0:0.04, v/v/v), gave compact spot of CRL at Rf 0.56 ± 0.05. The spectrodensitometric analysis was performed at 242 nm. The linear graph upon regression analysis showed r2 = 0.998 concerning peak area at the concentration range of 50–1000 ng spot−1. The limit of detection and quantification was found to be 7.9 and 24.2 ng spot-1, respectively. The drug was subjected to stress conditions like acid and alkali hydrolysis, oxidation, photodegradation, dry as well as wet heat treatment and evaluated for stability and degradation product. The acidic and alkaline degradation kinetics was also studied using developed HPTLC method. SLNs were developed using hot melt technique and subjected stability testing along with the commercial tablet.
Keywords: Carvedilol, Degradation kinetics, Solid lipid nanoparticles, Stability indicating, Validation
INTRODUCTION: Carvedilol (CRL), a third-generation antihypertensive and neurohormonal antagonist, acts by blocking adrenergic receptors 1. It enhances vasodilation via α1-adrenergic blockade, and at higher concentration, it also exhibits ion channel–blocking activity 2.
Chemically it is, 1-(9H-carbazol-4-yloxy)-3-[[2-(2-methoxy phenoxy) ethyl] amino]-2-propanol), and occurs as racemic mixture of S (-) and R (+) enantiomers Fig. 1 3.
The impurities occurring with the drug are impurity A,1-[[9-[2-hydroxy-3-[[2- (2-methoxy phenoxy) ethyl] amino] propyl]- 9H-cabazol-4-yl]oxy]-3-[[2-(2 methoxy phenoxy)ethyl] amino]propan-2-ol, impurity B, 1, 1’- [[ 2-(2-methoxy phenoxy)ethyl] nitrilo] bis [3-(9H-cabazol-4-yloxy)propan-2-ol] and impurity C, (2RS)-1- benzyl-[2-(2-methoxyphenoxy) ethyl amino]-3-(9H- carbazol- 4-yloxy) propan-2-ol 4. A non-pharmacopoeial impurity, 4-hydroxycarbazole, has been reported to occur as one of the degradation products 5.

FIG. 1: STRUCTURE OF CARVEDILOL
Several ancillary activities are also associated with CRL that includes antioxidant, anti-inflammatory, and antiapoptotic properties 2. The antioxidant effect of CRL is attributed to the carbazole moiety and the substitution of a hydroxyl group at a certain position on the phenyl ring of carbazole, or the ortho-substituted phenoxyl-ethylamine part of CRL, increases antioxidant activity 6.
Various analytical methods for the estimation and identification of the drug have been reported, which include, UV spectrophotometry 7, high performance liquid chromatography (HPLC) 8-13, high performance liquid chromatography with fluorescence detector 14, 15, high-performance liquid chromatography / tandem mass spectrometry (HPLC–MS/MS) 16, hydrophilic interaction liquid chromatography with tandem mass spectrometry (HILIC–MS/MS) 17, capillary electrophoresis 18 and high performance thin-layer chromatography (HPTLC) method 19, 20. The analytical methods listed so far, are more concerned with the bulk drug determination and study of kinetics or separation of degradants have not been reported.
So far, no exhaustive work related to the stability indicating HPTLC determination of CRL in bulk drug and from solid lipid nanoparticles (SLNs) has been reported in any literature. The kinetic study plays an important role in the drug development process as they predict physical and chemical stability by determining the degradation rate. It also helps to determine the shelf life of the pharmaceutical product. Additionally, kinetics and stability, in a way, are related as cause and effect phenomenon, the former determines, the later. Ideal stability indicating method should quantify the drug per se and resolve its degradation product.
Therefore, the objective of the study is to develop a stability indicating assay method using HPTLC, which would serve two major purposes like quantification and identification of drug products with separation of degradant. The second objective is to investigate kinetic stability of drug by incorporating it into solid lipid nanoparticles.
MATERIALS AND METHODS: CRL was provided as a gift sample from Zydus Cadila Health Care, Ltd (Ahmedabad, India). Stearic acid was purchased from Qualikems Fine Chemicals Pvt. Ltd. (India). Poloxamer 188 and sodium taurocholate were purchased from Merck (Germany). All other chemicals and reagents used were of analytical (AR) grade and were purchased from S.D Fine chemicals Mumbai, India.
Preparation of CRL-SLNs: CRL-SLNs were prepared using hot melt technique by dispersing warm o/w microemulsion in an ice-cold aqueous medium under mechanical stirring. Stearic acid (5%) was taken as the oil phase, poloxamer188 (5%) as a surfactant, and a mixture of sodium taurocholate (5%) and ethanol (10%) as co-surfactant. A clear microemulsion was obtained by gentle stirring at 70 °C (temperature slightly above the melting point of stearic acid). The prepared Microemulsion was immediately dispersed in cold water (2–3 °C), under mechanical stirring in a ratio of 1:10 (v/v). The obtained nano-suspensions were filtered and lyophilized using mannitol (5%) as a cryoprotectant to get dry powder of SLNs.
HPTLC Analytical Method: The CRL samples prepared were applied as 6mm bands with a Camagmicrolitre syringe on a pre-coated silica gel aluminum plate 60F-254 (20 cm × 10 cm), with 250 µm thickness, (E Merck Germany) using a CamagLinomat V applicator (Switzerland). A constant application rate of 0.1µLs-1 was employed, and space between the two bands was kept constant at 10 mm. The plates were developed in a linear ascending mode using toluene-chloroform-methanol-acetic acid (2.0:2.0:1.0:0.04, v/v/v) as mobile phase in a twin through glass chambers previously saturated with mobile phase for 30 min at room temperature. The chromatograms were developed up to 8 cm. The plates were dried in a current of air with the help of an air dryer. Spectrodensitometric scanning was performed using Camag TLC scanner III at the absorbance mode of 242 nm with specifications like slit size 6.0 mm × 0.45 mm, speed 20 mm s-1. The source of radiation utilized was deuterium and tungsten lamp.
Calibration Curve of CRL: A stock solution of CRL (1000µg mL-1) was prepared in methanol, and one mL from it was diluted up to 4 mL to get a concentration of 250µg mL-1. This solution was used for spotting on TLC plates to obtain concentrations ranging from 50 to 1000 ng spot-1. Each concentration was spotted thrice on the TLC plate. The data of peak areas and corresponding concentrations were treated by linear least-square regression analysis.
Method Validation: The method was validated for the following parameters as per ICH guideline 21.
Precision: For system precision, repeatability of the sample application and corresponding peak areas were measured using replicates of the same spot (600 ng spot−1 of CRL) and were expressed in terms of percent relative standard deviation (% R.S.D.). For method precision, the intra- and inter-day variation for the determination of CRL was conducted at three different concentration levels of 300, 600 and 1000 ng spot−1 and was expressed in terms of % R.S.D. and standard error (S.E.).
Robustness of the Method: Robustness was carried out by introducing small changes in the mobile phase composition; mobile phase volume and duration of mobile phase saturation and the effect on the results were examined. Mobile phases having different compositions of toluene-chloroform-methanol (2.0:2.0:1.1 and 2.0:2.0:0.9%, v/v/v) were tried and chromatograms were developed. Mobile phase volume and duration of saturation were varied at 25 ± 2 mL (23, 25 and 27 mL) and 30 ± 10 min (20, 30 and 40 min), respectively. Robustness of the method was studied in triplicate at a concentration level of 800 ng spot−1.
Limit of Detection (LOD) and Limit of Quantification (LOQ): LOD and LOQ were determined by the standard deviation method. For the determination of LOD and LOQ, the blank sample was injected in triplicate, and the peak area of this blank was recorded. The LOD and LOQ were calculated using the slope (S) of the calibration curve and standard deviation (SD) of the blank sample by following formulae:
LOD = 3.3 × SD / S AND LOQ = 10 ×SD/S
Where, SD is the standard deviation of the blank response, and S is the slope of the calibration curve.
Recovery Study: Recovery study was performed by applying the standard addition method to drug sample to which known amount of CRL corresponding to 50, 100, and 150% of the CRL label claim had been added. The experiment was performed in triplicate. This study was done to check for the recovery of the drug at different levels in the formulation.
Specificity: The specificity of the method was carried out by analyzing the standard drug and sample. The Rf values and spectra of the sample spots were compared with the standard. The peak purity of the CRL was ascertained by comparing the Rf value and UV spectra at three different levels, viz. peak start, peak apex, and peak end positions of the spot.
Forced Degradation of CRL: A stock solution containing 50mg of CRL in 50mL methanol was prepared. This stock solution (1000 µg mL−1) was subjected to forced degradation studies to indicate the stability and specificity of the proposed method. To 25 mL of methanolic stock solution of CRL:
- For acid-induced degradation study 25 mL of 2N HCl was added, and the mixture was refluxed for 3 h at 80 °C.
- For base induced degradation 25 mL of 2N NaOH was added, and the mixture was refluxed for 3 h at 80 °C.
- For oxidative degradation 25 mL of hydrogen peroxide (H2O2) (30%, v/v) was added and the mixture was heated in boiling water bath for 3h.
- For photochemical degradation 25 mL of methanol was added and the solution was exposed to direct sunlight for 3 days (from 09:00 to 17:00 h at 30 °C) on a wooden plank and kept on the terrace.
- For UV induced degradation 25 mL of methanol was added and the solution was exposed to UV irradiation at 254 nm for 24 h in a UV chamber.
- For wet heat-induced degradation 25 mL of methanol was added, and the solution was refluxed for 3 hr in boiling water bath.
- For dry heat-induced degradation, the powdered drug was stored in an oven at 100 °C for 3h. The stock solution was prepared to contain 25 mg of dry heat exposed drug in 50 mL methanol (500 µg mL−1).
In all the degradation studies, the volume was made up to 50 mL with methanol and 2 µL (1000 ng spot−1) of the resultant solutions were applied on TLC plate in triplicates. The chromatograms were developed and scanned as described above. The average peak areas of CRL were obtained.
Detection of Related Impurities: The related unknown impurities were determined by spotting higher concentrations of the CRL. CRL solution was prepared at a concentration of 1000 µg mL−1 in methanol (sample solution). One milliliter of the sample solution was diluted to 5mL with methanol, and this solution was termed as the standard solution (200 µg mL−1). Two microliters of the sample solution (2000 ng spot−1) and two microliters of the standard solution (400 ng spot−1) were applied in triplicates (n=3) on HPTLC plate, and the chromatograms were run.
Kinetic Study: In order to study the kinetics of acid and base induced degradation of CRL and CRL-SLN, samples were prepared by using pure CRL and SLNs equivalent to 5 mg of CRL and 10 mL each of these standard solutions were transferred into 20mL of double neck graduated round bottom flask and mixed with 10 mL each of 2N HCl and 2N NaOH, respectively and the volume of solution was made up to 20 mL.
These flasks were refluxed at 40 °C, 50 °C and 60 °C temperatures for 3 h. At definite time intervals, the contents of the flask (2 mL each) were quantitatively transferred to a vial after adjusting the required volume with methanol and estimated by HPTLC method. All experiments were performed in triplicate, and the concentration of the drug remaining was also calculated. Degradation kinetic constant was calculated from data obtained.
Application of the Developed HPTLC Method:
Analysis of CRL in Tablet and Solid Lipid Nanoparticles: To determine the content of CRL in marketed tablets (label claim: 25 mg/tablet) and prepared solid lipid nanoparticles (label claim: 6.25 mg / 100 mg of solid lipid nanoparticles), ten tablets were weighed, and their mean weight was determined. Powder (Coreg®, tablets) and solid lipid nanoparticles equivalent to 5.0mg of CRL was accurately weighed and transferred into a volumetric flask containing 5.0mL of chloroform.
To completely extract the drug, it was sonicated for 30 min, and volume was adjusted to 10mL with methanol and then centrifuged, for 10 min, at 3000 rpm. Two microlitres (1000 ng spot−1) of the supernatant from the centrifuged solution was applied on TLC plates and analyzed as described above. The experiment was repeated thrice, and the possibility of excipient interference in the analysis was studied.
Analysis of Accelerated Stability Samples: Among several available marketed tablets, Coreg® Tablet (SmithKline Beecham, India) was taken and stored in the stability chamber at the accelerated stability conditions: 40 °C, 50 °C, and 60 °C temperatures, at 75 ± 5 % Rh for 6 months. Similarly, the exact quantity of CRL-SLN was packed in screw-capped high-density polyethylene container and stored at the same accelerated stability temperatures and humidity for 6 months. Testing samples were withdrawn at time points: initial (zero time), 1st, 3rd, and 6th months and the remaining amount of drug contents were analyzed by the developed HPTLC method.
RESULTS AND DISCUSSION:
Development of the Optimum Mobile Phase: In the initial stages, the TLC process was optimized to achieve accuracy in the assay method. The mobile phase consisting of toluene-chloroform-methanol were tried in various ratios, and it was found that a ratio of (2.0:2.0:1.0%, v/v/v) gave good resolution with Rf = 0.56 for CRL, but there was band broadening and the peak obtained was not sharp and compact. Addition of one drop of acetic acid improved the spot characteristics.
Thus, toluene–chloroform–methanol-acetic acid in ratio of 2.0:2.0:1.0:0.04, v/v/v/v was selected as it gave sharp and well-defined symmetrical peak with Rf = 0.56 ± 0.05. The developed analytical procedure was also time-saving as it could be completed in about 1 h duration which also included the pre-analysis steps viz. washing of HPTLC plates with methanol and activation at 70 °C (30 min); preparation of mobile phase and saturation of development chamber (30 min). UV spectral measurement of spots showed maximal absorbance at 242 nm due to cyclic structures of CRL and its degradation products, and therefore it was chosen as the wavelength for UV densitometry.
Calibration Curve: The linear regression data for the calibration curves (n = 3) as given in Table 1 showed a good linear relationship over concentration range 50–1000 ng spot−1 concerning the peak area. No significant difference was observed in the slopes of standard curves (ANOVA, P > 0.05) Table 1.
Validation of the Method:
Precision: The % R.S.D. for repeatability of sample application (600 ng spot−1) was found to be 0.97. The intra and inter-day precision of the CRL was determined at three different concentrations of 300, 600 and 1000 ng spot−1 and the % R.S.D. was found in between 0.95–1.20% and 1.05–1.45% respectively. The low value of % R.S.D. (<2%) revealed good precision of the method Table 2.
TABLE 1: LINEAR REGRESSION DATA FOR CALIBRATION CURVE (n = 3)
| Linearity range (ng spot-1) | 50-1000 |
| Regression equation | Y=12.195x + 86.521 |
| Correlation coefficient (r ± S.D.) | 0.998±0.001 |
| Slope ± SD | 12.195 ± 0.0753 |
| Confidence limit of slopea | 12.007-12.382 |
| Intercept ± SD | 86.521 ±0.199 |
| Confidence limit of intercepta | 84.888-86.608 |
a 95% confidence limit
TABLE 2: INTRA AND INTER-DAY PRECISION OF HPTLC METHOD (n = 3)
| Amount
(ng spot−1) |
Intraday precision | Interday precision | ||||||
| Mean area | SD | % RSD | S.E | Mean area | SD | % RSD | S.E | |
| 300 | 3775.61 | 36.24 | 0.95 | 20.92 | 3714.74 | 55.01 | 1.45 | 31.76 |
| 600 | 7487.69 | 86.25 | 1.15 | 49.80 | 7437.64 | 96.43 | 1.29 | 55.67 |
| 1000 | 12333.71 | 149.17 | 1.20 | 86.12 | 12306.14 | 115.57 | 1.05 | 75.00 |
Robustness of the Method: The % R.S.D. of the peak areas were calculated for change in mobile phase composition, mobile phase volume, duration of saturation and activation of prewashed TLC plates at a concentration level of 800 ng spot−1 in triplicate. The low values of % R.S.D. (<2) obtained after introducing small, deliberate changes in the developed HPTLC method indicated the robustness of the method Table 3.
TABLE 3: ROBUSTNESS OF THE HPTLC METHOD (n =3, 800 ng SPOT−1)
| Parameter | S.D. ( peak area) | % R.S.D. | S.E. |
| Mobile phase composition (toluene-chloroform-methanol)
2.0:2.0:1.1, v/v/v 2.0:2.0:0.9, v/v/v |
57.018 | 1.16 | 32.92 |
| Mobile phase volume (18, 20 and 22 ml) | 55.275 | 1.07 | 31.91 |
| Duration of saturation (20, 30 and 40 min) | 56.167 | 1.19 | 32.43 |
| Activation of prewashed TLC plates (2, 5 and 7 min) | 75.996 | 1.58 | 43.88 |
LOD and LOQ: LOD and LOQ were determined by the standard deviation method and were found to be 7.9 ng spot-1 and 24.2 ng spot-1, respectively. The low values of LOD and LOQ indicated the sensitivity of the proposed method.
Recovery Studies: The proposed method when used for extraction and consequent estimation of CRL from marketed formulation and solid lipid nanoparticles after spiking with 50, 100 and 150% of the additional drug, gave mean recovery of 99.13%, 99.05%, and 99.62% respectively. The % R.S.D. (with S.E.) values after spiking with 50, 100 and 150% of the additional drug were found to be 0.634 (1.089), 0.701 (1.594) and 0.594 (1.698) respectively Table 4.
Specificity: A single spot at Rf 0.56 was observed in the chromatogram of the CRL samples extracted from tablets and CRL-SLNs. The peak purity of the CRL was evaluated by comparing the spectra at peak start, peak apex, and peak end positions of the spot. Good correlation (r2 = 0.998) between the standard and the sample spectra of CRL and absence of interference peaks of degradation products, impurities and excipients showed the specificity of the method.
TABLE 4: RECOVERY STUDIES (n = 6)
| Excess drug
added to the analyte (%) |
Theoretical
content (ng) |
Amount
obtained (ng) |
(%)
Recovery |
% R.
S.D. |
S.E.
|
| 0 | 200 | 196.53 | 97.3 | 0.99 | 1.13 |
| 50 | 300 | 297.51 | 99.13 | 0.63 | 1.09 |
| 100 | 400 | 393.83 | 99.05 | 0.70 | 1.59 |
| 150 | 500 | 494.80 | 99.62 | 0.59 | 1.70 |
Forced Degradation of CRL: The chromatograms of the samples degraded in stress conditions of acid, base, oxidative, photochemical, UV, wet heat, and dry heat-induced degradation. The peak heights showed well-separated spots of the pure drugs as well as some additional peaks at different Rf values. The spots of degraded products were well resolved from the drug spots, as shown in Fig. 2a-g. The stability indicating the property of the proposed method can be established as the peak of CRL did not significantly shift in the presence of degradation peaks. The content of CRL in stress condition and number of degradation products with their Rf values are shown in Table 5.
TABLE 5: FORCED DEGRADATION OF CARVEDILOL
| S.
no. |
Exposure
conditions |
Degradation
products Rf |
Fig. | Drug remained (1000 ng/spot) (± S.D., n = 6) | Recovery (%) | |
| 1 | 2N HCl, refluxed (3 h) | 0.32, 0.70, 0.83 | Fig. 2a | 596.418 ± 2.92 | 59.64 | |
| 2 | 2N NaOH, refluxed (3 h) | 0.21, 0.25, 0.36, 0.75 | Fig. 2b | 468.700 ± 3.23 | 46.87 | |
| 3 | H2O2, 30% v/v, refluxed (3 h) | 0.26, 0.39, 0.72,0.87, | Fig. 2c | 582.459 ± 7.29 | 58.24 | |
| 4 | Sun light (3 days) | 0.38, 0.77, 0.80, 0.87, 0.91 | Fig. 2d | 559.798 ± 1.52 | 55.97 | |
| 5 | UV light, 254 nm (24 h) | 0.13, 0.32, 0.47, 0.72, 0.77, 0.80,0.84 | Fig. 2e | 675.542 ± 2.30 | 67.54 | |
| 6 | Wet heat, 100 °C (3h) | 0.18, 0.23, 0.36, 0.70,0.87 | Fig. 2f | 879.64 ± 2.86 | 87.96 | |
| 7 | Dry heat, 100 °C (3 h) | 0.27, 0.41, 0.73,0.81 | Fig. 2g | 867.53 ± 1.08 | 86.75 | |
Acid and Base-Induced Degradation Product: Drug recovery at the level of 59.64% and 46.87% from the acid and base stressed samples, respectively, suggested significant (P<0.05) degradation of CRL in these conditions Table 5. The difference in drug recovery level indicated that alkaline degradation is more pronounced than acidic degradation. The chromatograms of the acid degraded sample showed three additional peaks at Rf values of 0.32, 0.70, and 0.83, respectively Fig. 2a. The chromatograms of the base degraded sample showed additional four peaks at Rf value of 0.21, 0.25, 0.36, and 0.75 Fig. 2b. Different Rf values obtained from acid and base treated samples indicated that acid degradation products are different from base degradation products.
Hydrogen Peroxide-Induced Degradation Product: The chromatogram of the sample of CRL treated with 30% (v/v) H2O2 Fig. 2c showed four additional peaks other than the standard CRL peak at Rf values 0.26, 0.39, 0.72 and 0.87 respectively, suggesting CRL is susceptible to oxidation, and a significant amount of drug (41.76%) was degraded.
Photochemical Degradation Product: Drug was found liable to photochemical degradation as it showed 44.03 and 32.46% degradation in the sunlight as well as UV light (254 nm). It suggested significant (P<0.05) degradation of CRL in these conditions. It also revealed its higher susceptibility towards the sunlight degradation than UV irradiations. The sunlight degraded sample gave an additional five peaks at Rf values of 0.38, 0.77, 0.80, 0.87, and 0.91 Fig. 2d. Whereas UV light treated sample showed additional seven peaks at Rf values of 0.13, 0.32, 0.47, 0.72, 0.77, 0.80 and 0.84 Fig. 2e, Table 5.
Dry Heat and Wet Heat Degradation Product: A total of 12.09 and 13.25% of the drug were found degraded in the wet and dry heat treated samples, respectively. The chromatograms of the wet heat sample gave five additional peaks at Rf values of 0.18, 0.23, 0.36, 0.70 and 0.87 Fig. 2f, whereas the chromatograms of the dry heat treated sample also showed four different additional peaks at Rf value of 0.27, 0.41, 0.73 and 0.81 Fig. 2g.
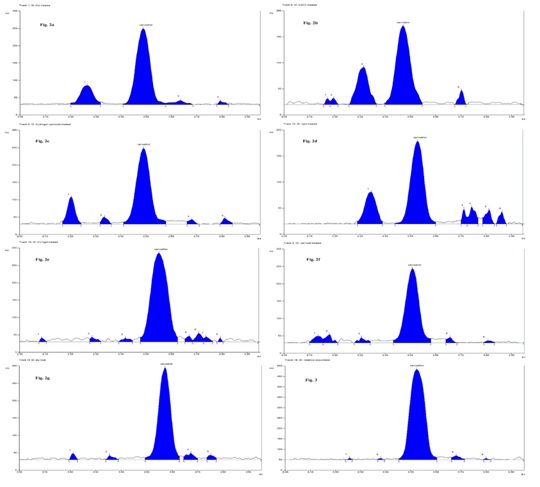
FIG. 2: REPRESENTATIVE CHROMATOGRAMS OF CRL AFTER FORCED DEGRADATIONS: TREATED WITH 2N HCl (a); WITH 2N NaOH (b); WITH 30% H2O2 (c) WITH SUNLIGHT (d) WITH UV AT 254 nm (e); WET HEAT (f); WITH DRY HEAT (g) AND THE RELATIVE IMPURITIES OF CARVEDILOL
Detection of the Related Impurities: The spot other than the principal spot for CRL from the sample solution was not more intense than the principal spot from the standard solution. The sample solution showed four additional peaks at Rf values 0.28, 0.43, 0.72, and 0.86 Fig. 2. However, the area of the additional spots was found significantly smaller than the spot area of CRL from the standard solution.
The Chromatogram showing a peak at Rf 0.72 ± 0.03 had similarity with the peak of one of the degradant when the drug was subjected to base hydrolysis, dry heat, wet heat, and photochemical degradation. It may be inferred that the peak corresponding to Rf 0.72 could be of impurity C (2RS)-1- benzyl-[2-(2-methoxy phenoxy) ethyl amino]-3-(9H-carbazol-4-yloxy) propan-2-ol or 4-hydroxycarbazole. The latter is also used for the synthesis of CRL, and could be its common degradant keeping in view its synthetic route. However, the other peaks of Rf 0.28, 0.43 and 0.86 may be of the other impurities as reported by Galanopolou et al., 2008 22. The peak of impurities was well resolved from the drug and the degradant, and thus they would not interfere with the analysis of CRL-SLNs by the developed stability indicating HP-TLC method.
Kinetics Studies: The kinetics of degradation of CRL was investigated in 2N HCl and 2N NaOH. The experiment was repeated thrice, and the mean concentration of CRL was calculated for each experiment. It was observed that the concentration of the drug decreased with increase in time. At the selected temperature (40 °C, 50 °C and 60 °C) the degradation process followed first-order kinetics Fig. 3A and 3B. 23
The slope of the straight lines at each temperature for acidic and alkaline degradation processes Table 6 was used to calculate first-order rate constant (K), half-life (t1/2) and shelf life (t90) (i.e., time where 90% of the original concentration of the drug is left). Using the Arrhenius equation, the data obtained from first-order kinetics were further processed:
LogK= Log A – (Ea/2.303 RT)
Where, K is the rate constant, A the frequency factor (Kcal mol−1), Ea is the energy of activation (cal mol−1), R is the gas constant (1.987 cal−1 K mol−1), and T is the absolute temperature (K). A plot of (log K) values versus the reciprocal temperature (1/T×10-3), the Arrhenius plot Fig. 3C, was found to be linear in the selected temperature range (40–60 °C). An extrapolation of the Arrhenius plot is used to obtain the degradation rate constants of acidic and alkaline degradation processes at room temperature (25 ± 2 °C). The first order t1/2 and t90 were also calculated for acid/alkali degradation at 25 °C. Data Table 7 suggested that the drug is highly susceptible to acidic and alkaline degradation.

FIG. 3: FIRST ORDER PLOTS FOR THE DEGRADATION OF CARVEDILOL SOLUTION WITH 2N HCl (A); 2N NaOH (B); AND ARRHENIUS PLOT FOR THE DEGRADATION (C) AT VARIOUS TEMPERATURES. 40 °C; 50 °C AND 60 °C
TABLE 6: DEGRADATION RATE CONSTANT (K OBS), HALF LIFE (T1/2), AND SHELF LIFE (T90) FOR CARVEDILOL
| Temperature (K) | Kobs (h−1) | t1/2 (h) | t90 (h) | R2 for First order plots |
| In 2N HCl | ||||
| 313 | 0.1100 | 6.29 | 0.96 | 0.9909 |
| 323 | 0.1303 | 5.31 | 0.81 | 0.9975 |
| 333 | 0.1659 | 4.17 | 0.64 | 0.9916 |
| In 2N NaOH | ||||
| 313 | 0.1439 | 4.81 | 0.73 | 0.998 |
| 323 | 0.2144 | 3.23 | 0.49 | 0.9968 |
| 333 | 0.2583 | 2.68 | 0.41 | 0.9929 |
TABLE 7: DEGRADATION KINETIC OF CARVEDILOL AT 25 ± 2 °C
| Parameters | 2N HCl | 2N NaOH |
| Activation energy,
Ea (Kcal mol−1) |
7.70 | 11.08 |
| Degradation rate constant
K25 (h−1) |
7.703 × 10⁻² | 9.079× 10⁻² |
| Half life, t1/2 (h) | 8.99 | 7.63 |
| Shelf life, t90 (h) | 1.37 | 1.16 |
| Arrhenius frequency factor,
A (Kcal mol−1) |
2.128 | 9.085 |
Application of the Developed HPTLC Method:
Analysis of CRL in Tablet and CRL-SLNs: A single peak was observed in the chromatogram of CRL samples extracted from tablets and prepared solid lipid nanoparticles. It can be inferred from the result that there was no interference from the excipients in tablets or SLNs. The drug content (%) with % RSD of all the tested samples are given in Table 8.
TABLE 8: ANALYTICAL REPORT OF CARVEDILOL IN TABLETS AND SOLID LIPID NANOPARTICLES
| Samples | Theoretical Conc. (ng/mL) | Concentration found | %Drug Content | % RSD |
| Tablet |
600 |
595.55 | 99.06 | 0.42 |
| Solid Lipid Nanoparticles | 598.43 | 99.75 | 0.20 |
It may, therefore, be concluded that degradation of CRL had not occurred in the formulations that were analyzed by this method. The low %RSD value indicated the suitability of this method for routine analysis of CRL in conventional and novel drug delivery systems.
Accelerated Stability Testing: The method of accelerated testing of pharmaceutical products based on the principle of chemical kinetics could be used as a measure of the stability of the drug under the stressed conditions. Stability testing should be conducted to provide information about the storage condition, labeling on the product, and its in-use period after reconstitution. In general, under the given storage conditions, the drug product should be evaluated for its thermal stability and sensitivity to moisture or loss of solvent. In the present investigation, the accelerated study was performed to calculate the shelf-life of the drug products. At temperatures, 40 °C, 50 °C and 60°C, the process of drug degradation followed first-order kinetics Fig. 4A and Fig. 4B.
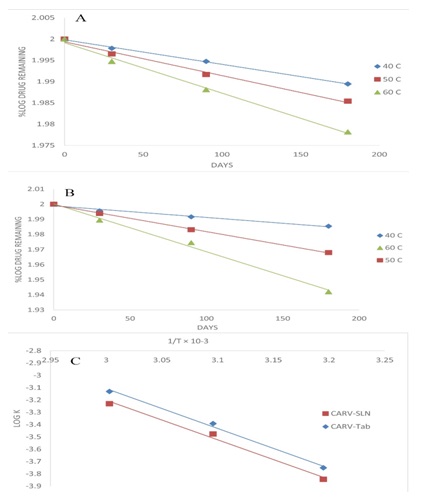
FIG. 4: FIRST ORDER PLOTS FOR THE DEGRADATION OF CARVEDILOL FROM TABLET DOSAGE FORMS: TAB-1 (A), AND CRL-SLN (B) AT TEMPERATURE RANGES OF 40–60 °C. ARRHENIUS PLOTS FOR CRL DEGRADATION FROM DIFFERENT DOSAGE FORMS (C)
TABLE 9: DEGRADATION KINETICS OF DRUG PRODUCT AT 25 °C (298 K)
|
Parameters |
Formulation | |
| Tablet | CL-SLN | |
| K25 (days)a | 4.10 × 10⁻³ | 5.80× 10⁻³ |
| t1/2 (years)b | 4.63 | 3.27 |
| t90 (years)c | 0.70 | 0.49 |
a Degradation rate constant, b Half life, c Shelf life
The obtained data from first-order kinetics were fitted in the Arrhenius equation, as mentioned above. The plots of Log K versus (1/T × 10-3) K, was linear in the temperature range of 40-60 °C Fig. 4C. The correlation coefficient for the line fittings was found to be 0.9906 and 0.9946 for TAB and CRL-SLN, respectively. The decay rate constant at room temperature (K25) is obtained by extrapolating to 25 °C and t1/2 and t90 were calculated and values are presented in Table 9.
CONCLUSION: The developed HPTLC technique is accurate, precise, specific, and stability indicating one. As proved by the statistical analysis the method is reproducible and selective for the analysis of CRL in bulk drug and SLNs. The method has been validated as per ICH guidelines for its robustness and reproducibility. The method could be used for the determination of purity of the drug from various sources and for separation and quantification of related impurities. The method could also be employed for studying degradation kinetics of CRL under various stress conditions and thus predicting its half-life, shelf life, and various other related kinetics constants. Hence the method could also be used for qualitative and quantitative analysis.
ACKNOWLEDGEMENT: Nil
CONFLICT OF INTEREST: Nil
REFERENCES:
- Ruffolo RR, Gellai M, Hieble JP, Willette RN and Nichols AJ: The pharmacology of carvedilol. European Journal of Clinical Pharmacology 1990; 38: S82-S88.
- Brian D and William TA: Pharmacology of carvedilol. The American Journal of Cardiology 2004; 93: 3–6.
- Parfitt K: Martindale: The complete drug reference. Pharmaceutical Press, UK 1999; 838.
- European Pharmacopoeia 2008; 01: 1745.
- Stojanovi J, Vladimirov S, Marinkovi V, Velikovi D and Sibinovi P: Monitoring of the photochemical stability of carvedilol and its degradation products by the RP-HPLC method. J of Serbian Chemical Society 2007; 72: 37- 44.
- Yue TL, Cheng HY, Lysko PG, Mckenna PJ, Feuer- Stein R, GUJL, Davis LL and Feuerstein G: Carvedilol, a new vasodilator and beta-adrenoceptor antagonist, is an antioxidant and free radical scavenger. Journal of Pharmacology Expert Therapeutics 1992; 26: 92- 98.
- Jain PS, Talele GS and Surana SJ: Spectrophotometric determination of carvedilol from bulk and formulations. Indian J of Pharmaceutical Sciences 2005; 67: 358-359.
- Reiff K: High-Performance Liquid Chromatographic method for the determination of carvedilol and its desmethyl metabolite in body fluids. Journal of Chromatography 1987; 413: 355-362.
- Hokama N, Hobara N, Kameya H, Ohshiro S, Sakanashi M: Rapid and simple micro-determination of carvedilol in rat plasma by High-Performance Liquid Chromatography. Journal of Chromatography. B 1999; 732: 233- 238.
- Yamsani VV, Gannu R, Yamsani MR Yue TL, Cheng HY, Lysko PG, Mckenna PJ, Feuer- Stein R, Davis LL and Feuerstein G: Carvedilol, a new vasodilator and beta-adrenoceptor antagonist, is an antioxidant and free radical scavenger. J of Pharmacol Expert Therap 1992; 26: 92-98.
- Veerabrahma K: High-performance liquid chromatography determination of carvedilol in pig serum. Journal of Chromatography Science 2010; 48: 348-352.
- Ptacek P, Macek J and Klima J: Liquid chromatographic determination of carvedilol in human plasma. Journal of Chromatography. B 2003; 789: 405-410.
- Gebremariam K and Sankar DG: RP-HPLC method for estimation of carvedilol in pharmaceutical dosage forms. American Journal of Pharmaceutical Technical Research 2012; 2: 513-521.
- Amran MH, Dipu RK, Tasnuvc S, Mahfuz M and Sharmin RC: A simple reversed-phase high-performance liquid chromatography method development and validation for determination of carvedilol in pharmaceutical dosage forms. International Journal of Advanced Pharmaceutical Analysis 2013; 3: 68-71.
- Rathod R, Prasad LPC, Rani S, Nivsarkar M and Padh H: Estimation of carvedilol in human plasma by using HPLC-fluorescence detector and its application to a pharmacokinetic study. Journal of Chromatography. B 2007; 857: 219-223.
- Bhavna AP, Sharddha JP, Jigar BP, Gautam RC and Aanandi DC: Development and validation of chromatographic determination of carvedilol phosphate in bulk and pharmaceutical dosage form using fluorescence detector. International Journal of Pharmaceutical Science Research 2012; 3: 4404-4407.
- Wang ES, Kratz J and Cyronak MJ: Stereoselective analysis of carvedilol in human plasma using HPLC/MS/MS after chiral derivatization. Journal of Pharmaceutical Biomedical. Analysis 2004; 36: 609- 615.
- Jeong DW, Kim YH, Ji HY, Youn YS and Lee KC: Analysis of carvedilol in human plasma using hydrophilic interaction liquid chromatography with tandem mass spectrometry Journal of Pharmaceutical Biomedical. Analysis 2007; 44: 547-552.
- Clohs L and McErlane KM: Comparison between capillary electrophoresis and High-Performance Liquid Chromatography for the stereo-selective analysis of carvedilol in serum. Journal of Pharmaceutical Biomedical. Analysis 2003; 31: 407- 412.
- Patel LJ, Suhagia BN, Shah PB and Shah RR: RP-HPLC and HPTLC method for the estimation of carvedilol in bulk drug and pharmaceutical formulations. Indian Journal of Pharmaceutical Science 2006; 68: 790-792.
- Subhashini E and Sundhar BS: RP-HPLC method development and validation for the analysis of carvedilol in pharmaceutical dosage forms. International Journal of Science. Innovation Discovery 2011; 1: 433-440.
- ICH Q2 (R1), 2005. Validation of analytical procedure: text and methodology. Geneva: International Conference on Harmonization. <http://www.ich.org/fileadmin/Public_ Web_Site/ICH_Products/Guidelines/Quality/Q1A_R2/Step4/Q1A_R2__Guideline.pdf>.
- Galanopoulou O, Rozou S and Antoniadou-Vyza E: HPLC analysis, isolation and identification of a new degradation product in carvedilol tablets. Journal of Pharmaceutical Biomedical. Analysis 2008; 48: 70-77.
How to cite this article:
Faisal MS, Naz Z, Sawan M, Akhter MH, Ali J, Shakeel F and Baboota S: Stability indicating High-Performance Thin-Layer Chromatography for carvedilol in bulk drug and in solid lipid nanoparticles. Int J Life Sci & Rev 2017; 3(5): 50-59. doi: 10.13040/IJPSR.0975-8232.IJLSR.3(5).50-59.
All © 2015 are reserved by International Journal of Life Sciences and Review. This Journal licensed under a Creative Commons Attribution-NonCommercial-ShareAlike 3.0 Unported License.
Article Information
1
50-59
795
1878
English
IJLSR
M. S. Faisal*, Z. Naz, M. Sawan, M. H. Akhter, J. Ali, F. Shakeel and S. Baboota
Department of Pharmaceutics, College of Pharmacy, Al-asmarya University, Zliten, Libya.
faisal_pharmacy@yahoo.co.in
14 January 2017
08 May 2017
14 May 2017
10.13040/IJPSR.0975-8232.IJLSR.3(5).50-59
31 May 2017