


STABILITY INDICATING UV SPECTROSCOPIC METHOD FOR THE ESTIMATION OF METFORMIN HYDROCHLORIDE IN BULK AND TABLETS
HTML Full TextSTABILITY INDICATING UV SPECTROSCOPIC METHOD FOR THE ESTIMATION OF METFORMIN HYDROCHLORIDE IN BULK AND TABLETS
V. P. Patil *, S. S. Angadi, S. H. Kale, S. D. Shelke, S. T. Kawade and R. L. Kadam
Department of Pharmaceutical Analysis, Yash Institute of Pharmacy, Aurangabad - 431001, Maharashtra, India.
ABSTRACT: Background: Forced degradation studies are used to determine the degradation pathways and degradation products of the active pharmaceutical ingredients that could form during storage and facilitate formulation development, manufacturing and packaging. Aim: To develop and validate simple and precise stability indicating UV Spectrophotometric method for Metformin Hydrochloride in the bulk and tablet dosage form. Material and Method: Separation of the drug from its degradation products was achieved by UV Spectrophotometric method using distilled water and scanned between 200 to 400 nm. Metformin Hydrochloride was subjected to stress conditions such as hydrolysis (acid and base), oxidation, photolysis, and thermal degradation. The degraded samples were further analyzed by using this method. Results: The maximum absorbance was found to be at 232.2nm and found to be linear over the range 2-10µg/ml with good correlation coefficient (r2) 0.998. The limits of detection and quantification were 0.5232 and 1.5856µg/ml, respectively. Major degradation was observed in acid hydrolysis, photolysis, and oxidative conditions. Metformin Hydrochloride was quite stable under the other stress conditions investigated. Conclusion: The UV Spectrophotometric method for Metformin Hydrochloride in the bulk and tablet dosage form was developed and validated. Thus, the method is proved to be stability indicating and was found to be an economical, selective, and sensitive for the desirable range.
Keywords: Metformin Hydrochloride, Forced degradation, UV Spectrophotometry
INTRODUCTION: Metformin Hydrochloride (MET) is chemically N, N dimethylimido dicarbonimidic diamide hydrochloride Fig. 1. It is white crystalline powder, hygroscopic and freely soluble in water. It is official in Indian Pharmacopoeia 1, United State Pharmacopoeia 2 and European Pharmacopoeia 3.
It is a member of the biguanide class of oral antihyperglycaemic, improves insulin sensitivity by increasing peripheral glucose uptake and utilization, decreases hepatic glucose production and intestinal absorption of glucose. MET is the first line drug for the treatment of type II diabetes, particularly in overweight or obese people and those with normal kidney function.
Evidence suggests that it may be the best choice for people with heart failure. It is also used in the treatment of polycystic ovary syndrome. Major action of MET is to increase glucose transport across the cell membrane in skeletal muscle 4- 5.
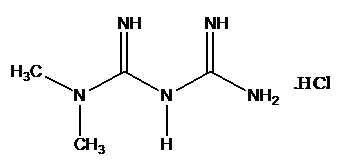
FIG. 1: STRUCTURE OF METFORMIN HYDROCHLORIDE (MET)
Literature survey reveals that methods available for estimation of Metformin hydrochloride include UV spectrophotometry 6-7, HPLC 8-9, HPTLC 10-11, UPLC 12, and Capillary Electrophoresis13. To the best of author’s knowledge, there are few stability indicating RP-HPLC 14, HPTLC 15 and UV spectroscopy 16 methods are available for MET. Forced degradation studies of Metformin by using distilled water as solvent being advantageous as plenty of availability, inexpensive, non-volatile, and relatively eco-friendly. Thus, there is a need for eco-friendly and economic stability, indicating UV spectroscopic method for the study of Metformin hydrochloride in bulk and its dosage forms.
The stability-indicating assay is a method that is employed for the analysis of stability samples in pharmaceutical industry 17. Stress testing of a drug substance can help in turn establish the degradation pathways and the intrinsic stability of the molecule 18-19. The quality of the finished product is very important from its safety, acceptability, and efficacy. Thus stability is considered as one of the most important criteria in pharmaceutical quality control as stable preparations would promise precise delivery of the drug to the patients.
The present study mainly deals with the forced degradation of Metformin hydrochloride under the stress conditions like acid and base hydrolysis, oxidation, heat and light and validation of the method for accurate quantification of Metformin in the bulk and tablet dosage form.
MATERIALS AND METHOD:
Apparatus: A Shimadzu 1800 double beam UV-VIS spectrophotometer provided with 1 cm matched quartz cell was used for absorbance measurement.
Reagents and Chemicals: Metformin HCl was obtained as a gift sample for Wockhardt Pharmaceuticals Pvt. Ltd. (Aurangabad, India). All other reagents used were of analytical grade.
Preparation of Standard solution of MET: 10 mg pure MET was transferred to a 100ml volumetric flask and diluted up to the mark with distilled water to get a concentration of 100µg/ml solution. In a 10 ml volumetric flask, pipette out 1ml from the standard stock solution and dilute it up to the mark with distilled water (10µg/ml) and scanned between 200 to 400nm and 232.20nm was found to be maximum wavelength for absorption as shown in Fig. 2.
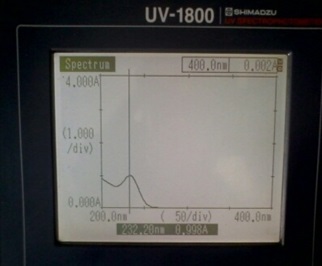
FIG. 2: STANDARD SPECTRUM OF MET AT 232.20 nm WITH 0.998 ABSORPTION
Forced Degradation Studies:
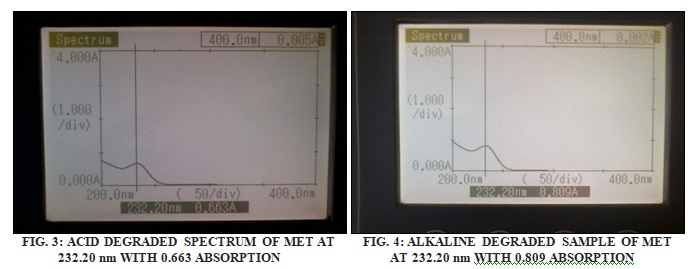
Acid and Alkaline Hydrolysis: Forced degradation in acidic media was performed by adding 10 mg of MET to 10 ml 0.01N HCl and refluxing the mixture at 80 ºC for approximately 2 h. The solution was then left to reach ambient temperature, neutralized to pH 7 by addition of 0.01N NaOH. In a 10 ml volumetric flask, pipette out 1ml from above solution and dilute it up to the mark with distilled water (100µg/ml).
In a 10 ml volumetric flask pipette out 1ml from above solution and dilute it up to the mark with distilled water to get final concentration 10 µg/ml and run the spectrum as shown in Fig. 3.
Forced degradation in alkaline media was performed by adding 10 mg of MET to 10 ml 0.01 N NaOH and refluxing the mixture at 80ºC for approximately 2 hours. The solution was then left to reach ambient temperature, neutralized to pH 7 by addition of 0.01N HCl. In a 10ml volumetric flask, pipette out 1ml from above solution and dilute it up to the mark with distilled water (100µg/ml). In a 10ml volumetric flask, pipette out 1ml from above solution and dilute it up to the mark with distilled water to get final concentration 10 µg/ml and run the spectrum as shown in Fig. 4.
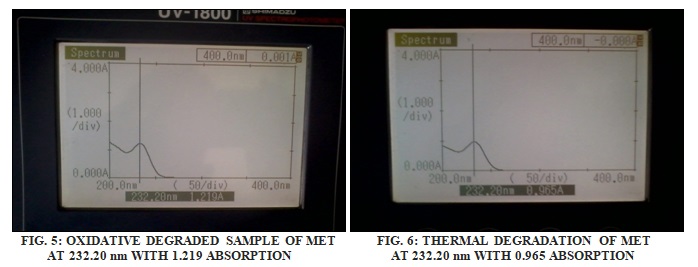
Oxidative Degradation: To study the effect of oxidizing conditions, 10 mg of MET was added to 10 ml 3% H2O2 solution. In a 10ml volumetric flask, pipette out 1ml from above solution and dilute it up to the mark with distilled water (100µg/ml). In a 10ml volumetric flask, pipette out 1ml from above solution and dilute it up to the mark with distilled water to get final concentration 10 µg/ml and run the spectrum as shown in Fig. 5.
Thermal Degradation: To study the effect of temperature, approximately 10 mg MET was stored at 80ºC for 2 days. Then, 10 mg taken and was dissolved in distilled water and volume was adjusted up to 10 ml with distilled water to get the concentration of 1000 µg/ml. Pipette out 1ml from above solution and dilute it up to the mark with distilled water (100 µg/ml).
In a 10 ml volumetric flask, pipette out 1ml from above solution and dilute it up to the mark with distilled water to get final concentration 10µg/ml and run the spectrum as shown in Fig. 6.
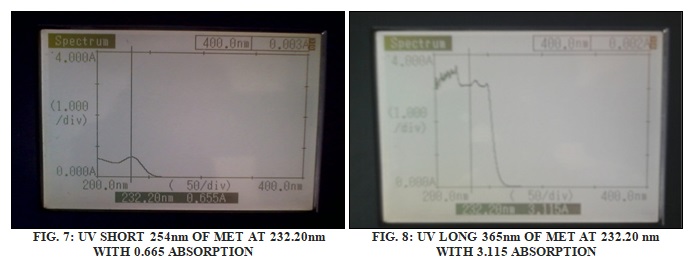
Photolysis: To study the effect of UV light, approximately 10 mg MET was exposed to short and long wavelength UV light (254 and 366nm, respectively) for 24 h, then dissolved in distilled water and made up volume 10 ml in a volumetric flask to get the concentration of 1000 µg/ml. Further dilution was made with distilled water to get final concentration 10µg/ml and run the spectrum, as shown in Fig. 7 and 8.
Method Validation: The method was validated for linearity, limits of detection (LOD) and quantification (LOQ), precision, accuracy, and stability by ICH Guidelines 20.
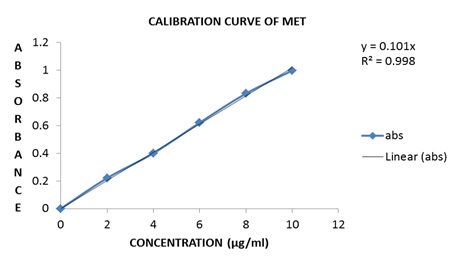
FIG. 9: CALIBRATION CURVE FOR MET AT 232.20 nm
Linearity: 10 mg pure MET was transferred to 100 ml volumetric flask and diluted up to the mark with distilled water to get a concentration of 100µg/ml solution. Aliquots of 2,4,6,8 and 10ml from a standard stock solution of MET were pipette out in 10 ml volumetric flasks, and the volume was made up to 10 ml with distilled water to get concentration 2,4,6,8 and 10µg/ml of MET respectively. The absorbance was measured in triplicate at 232.20 nm against reagent blank. The calibration curve was constructed by plotting absorbance v/s concentration, as shown in Fig. 9.
Detection Limits: The limits of detection (LOD) and quantification (LOQ) for MET were determined, as the amounts for which signal-to-noise ratios were 3:1 and 10:1, respectively.
Precision: To determine precision, 7 days measurement (intra-days and interday) were computed with relative standard deviation (RSD %) for replicate samples (n=5) using concentration 6, 8, and 10µg/ml. Both the intra-day and inter day samples were calibrated with standard curve concurrently prepared on the same day of analysis.
Intraday Precision: Intraday precision of the test method is demonstrated by three samples of the same batch (same concentration) at initial, 24, and 48 h Table 1.
Interday Precision: Interday precision of the test method is demonstrated by three samples of the same batch (same concentration) on three successive days Table 1.
TABLE 1: EVALUATION OF INTRADAY AND INTERDAY ACCURACY AND PRECISION OF MET
| MET took (μg/ml) | Intraday Accuracy and Precision | Inter-day Accuracy and Precision | ||||
| MET found | RE % | RSD % | MET found | RE % | RSD % | |
| (μg/ml) | (μg/ml) | |||||
| 6 | 6.23 | 0.221 | 0.871 | 6.20 | 0.026 | 1.062 |
| 8 | 8.32 | 0.040 | 1.420 | 8.24 | 0.054 | 1.634 |
| 10 | 10.15 | 0.022 | 0.549 | 10.22 | 0.040 | 0.967 |
Accuracy: To determine the accuracy of the proposed method, recovery study was carried out by adding the different amount (80%, 100%, and 120%) of a bulk sample of MET within the linearity range and results obtained are compiled in Table 2.
TABLE 2: RECOVERY DATA OF MET
| Level | Amount of MET added (µg) | Amount of MET found (µg) | % Recovery | % RSD* |
| 80 % | 12 | 11.86 | 98.86 | 1.720 |
| 100 % | 15 | 14.95 | 99.67 | 1.575 |
| 120 % | 18 | 17.82 | 99.00 | 1.206 |
*An average value ± relative standard deviation of 5 observations
RESULTS AND DISCUSSION: The proposed method for MET showed molar absorptivity of 49.301 × 10³ L/mol/cm and sandell’s sensitivity of 0.01002µg/cm2 absorbance units. Linear regression of absorbance on concentration gave the equation y=0.101x with a correlation coefficient (r2) of 0.998. The relative standard deviation for intraday and interday analysis was found to be 0.9466 and 1.221, respectively.
Limit of detection and limit of quantification were found to 0.5232 and 1.5856µg/ml, respectively. The higher percentage recovery value indicates that there is no interference of the excipients present in the formulation. The optical characteristics and validation parameters of Metformin hydrochloride by UV spectroscopic method are tabulated in Table 3.
TABLE 3: VALIDATION PARAMETERS OF MET FOR UV-SPECTROSCOPIC METHOD
| Parameter | Analytical data |
| Linearity Range (µg/ml) | 2-10 |
| λ max (nm) | 232.2 |
| Molar extinction coefficient, L/mol/cm | 49.301x10³ |
| Sandell’s sensitivity, μg/cm2 | 0.01002 |
| Slope | 10.1 x 10⁻² |
| Intercept | 0.008 |
| Standard deviation about regression (Sy) | ±0.0192 |
| The standard deviation of Slope (Sb) | ±0.0023 |
| The standard deviation of intercept (Sa) | ±0.01396 |
| Correlation co-efficient (r) | 0.998 |
| Limit of detection (LOD, μg/ml) | 0.5232 |
| Limit of quantification (LOQ, μg/ml) | 1.5856 |
| Intraday Precision (% RSD) | 0.9466 |
| Interday Precision (% RSD) | 1.221 |
| Accuracy (% RSD) | 1.5 |
| Accuracy (% Recovery) | 99.97 |
Degradation Behaviour: UV-Spectrophotometry studies for MET under different stress conditions suggested the following degradation behavior Table 4.
TABLE 4: PERCENT DEGRADATION OF MET (10ug/ml) AND ABSORBANCE OF DEGRADATION PRODUCT AT 232.20nm
| Condition | MET | Time | Absorbance | Conc. Obtained | (%) | Degraded (%) | Observation |
| API | 0 hrs | 0.998 | 10.00 | 100 | 0.00 | Undegraed | |
| Acid | API | 2 hrs | 0.663 | 6.64 | 66.43 | 33.57 | Degraded |
| TAB | 0.840 | 8.41 | 84.16 | 15.84 | Undegraded | ||
| Alkaline | API | 2 hrs | 0.809 | 8.10 | 81.06 | 18.94 | Undegraded |
| TAB | 0.902 | 9.038 | 90.38 | 9.62 | Undegraded | ||
| Thermal | API | 24 hrs | 0.965 | 9.66 | 96.69 | 3.31 | Undegraded |
| TAB | 0.859 | 8.60 | 86.07 | 13.92 | Undegraded | ||
| Thermal | API | 48 hrs | 1.029 | 10.31 | 103.10 | 3.10 | Undegraded |
| TAB | 0.807 | 8.08 | 80.86 | 8.08 | Undegraded | ||
| UV 254 | API | 24 hrs | 0.985 | 9.85 | 98.59 | 1.41 | Undegraded |
| TAB | 0.975 | 9.75 | 97.5 | 2.50 | Undegraded | ||
| API | 48 hrs | 0.655 | 6.56 | 65.63 | 34.37 | Degraded | |
| TAB | 0.706 | 7.07 | 70.74 | 29.26 | Degraded | ||
| UV 365 | API | 24 hrs | 1.093 | 10.95 | 109.51 | 9.51 | Undegraded |
| TAB | 0.806 | 8.06 | 80.66 | 19.34 | Undegraded | ||
| API | 48 hrs | 3.115 | 31.81 | 312.12 | 212.12 | Degraded | |
| TAB | 1.741 | 17.44 | 174.44 | 74.44 | Degraded | ||
| 3% H2O2 | API | 1.219 | 12.21 | 122.14 | 22.14 | Degraded | |
| TAB | 1.139 | 11.42 | 114.24 | 14.24 | Undegraded |
The stability studies indicate that appreciable changes were observed by treating the drug, Metformin hydrochloride with UV light, thermal stress, oxidation, and hydrolysis along with their appreciable change in λmax values. However, there was no appreciable change, thermal degradation, and alkaline. Thus, the proposed UV method proved to be stability indicating.
CONCLUSION: All these factors lead to the conclusion that the stability indicating UV spectroscopic method development is accurate, precise, simple, sensitive and rapid and can be applied successfully for the estimation of Metformin hydrochloride in bulk and pharmaceutical formulations without interference using distilled water.
However, there was no appreciable change with thermal and alkaline hydrolysis. The relative standard deviation (RSD) for all parameters was found to be less than two, which indicate that the validity of the method is also within the limit so the proposed method can be used for routine quantitative estimation of Metformin hydrochloride in bulk and pharmaceutical formulations.
ACKNOWLEDGEMENT: The authors are grateful to Wockhardt Ltd. for supplying gift samples of pure drug. Authors are thankful to Yash Institute of Pharmacy, Aurangabad for providing instrumental and chemical facilities.
CONFLICT OF INTEREST: Nil
REFERENCES:
- The Indian Pharmacopoeia, 4th Edition, vol-І, New Delhi: The Controller of publications 1996: 469.
- The United States Pharmacopoeia. US Pharmacopoeial convention; Inc. Rockville, MD; 31st Revision 2008: 2640.
- European Pharmacopoeia. Council of Europe, France. 3rd Edition 1997; 55.
- Tripathi KD: Essential of Medical Pharmacology. Jaypee Brothers Medical Publishers, Fifth Edition, New Delhi, 2011: 254-73.
- Hardman JG and Limbird LE: Goodman & Gilman’s: The Pharmacological Basis of Therapeutics. McGraw-Hill International Edition. 10th Edition 2001: 1701, 1705.
- Sabat M, Venkateshwarlu G and Someshwar K: Estimation and validation of Metformin using UV–visible spectrophotometry in bulk drug and formulation. International Journal of Pharma World Research 2012; 3(3): 1-11.
- Kupkar S, Jadhav S and Kunjir V: Simultaneous estimation of Sitagliptin and Metformin hydrochloride in bulk and dosage form by uv spectrophotometry. Journal of Pharmacy Research 2012; 5(1): 580-82.
- Kar M and Choudhury PK: HPLC method for estimation of metformin hydrochloride in formulated microspheres and tablet dosage form. Indian Journal Pharmaceutical Science 2009; 71(3): 318-20.
- Doredla NR and Mannepalli C: Method Development and validation of RP-HPLC method for the simultaneous analysis of three component tablet formulation containing Metformin hydrochloride, Pioglitazone hydrochloride and Glibenclamide. International Journal of Pharm Tech Research 2012; 4(3): 948-56.
- Havele S and Dhaneshwar S: Estimation of Metformin in bulk drug and in the formulation by HPTLC. Journal of Nanomedicine & Nanotechnology 2010; 1(1): 100-02.
- Raja T and Rao AL: Validated HPTLC method for simultaneous estimation of Metformin hydrochloride and Sitagliptin phosphate in bulk drug and formulation. Rasayan Journal of Chemistry 2012; 5(3): 407-13.
- Malleswararao CS, Suryanarayana MV and Mukkanti K: Simultaneous determination of Sitagliptin phosphate monohydrate and Metformin hydrochloride in tablets by a validated UPLC method. Scientia Pharmaceutica 2012; 80: 139-52.
- Hamdan II, BaniJabe AK and Abushoffa AM: Development and validation of a stability indicating capillary electrophoresis method for the determination of Metformin hydrochloride in tablets. Journal of Pharmaceutical and Biomedical Analysis 2010; 53: 1254-57.
- Cristina SF and Catia BL: HPLC Stability indicating assay method for Metformin hydrochloride in bulk drug and tablets and cytotoxicity of degradation products. Current Pharmaceutical Analysis 2012; 8(4): 368-74.
- Thomas AB, Patil SD and Nanda RK: Stability-indicating HPTLC method for simultaneous determination of Nateglinide and Metformin hydrochloride in the pharmaceutical dosage form. Saudi Pharmaceutical Journal 2011; 19: 221-31.
- Rao DN, Rao MP, Hussain JN, Sumanoja SL and Rao VR: Method development and validation of forced degradation studies of Metformin hydrochloride by using UV spectroscopy. International Journal of Pharmaceutical, Chemical and Biological Sciences 2013, 3(3): 546-53.
- Bakshi M and Singh S: Development of validated stability indicating assay method- a critical review. Journal of Pharmaceutical and Biomedical Analysis 2012; 28: 1011-40.
- Patil P, Hamrapurkar P, Phale M and Gandhi M: Stress degradation studies on Lumefantrine and development of validated stability-indicating assay method. International Journal of Pharmaceutical Frontier Research 2011; 1(1): 11-20.
- Singh S, Rai J, Inamullah, Choudhary N, Hemendra G, Sharma S, Yadav A, Agrawal V and Chaturvedi S: Stability indicating simultaneous equation method for determination of Domperidone and (s)-Esomeprazole magnesium in capsule Dosage form using UV-spectrophotometer. British Journal of Pharmaceutical Research 2013; 3(3): 435-45.
- ICH [Stability Testing of New Drug Substances and Products (Q1AR2)], International Conference on Harmonization, Food and Drug Administration, USA, November 1996 and February 2003.
How to cite this article:
Patil VP, Angadi SS, Kale SH, Shelke SD, Kawade ST and Kadam RL: Stability indicating UV spectroscopic method for the estimation of metformin hydrochloride in bulk and tablets. Int J Life Sci & Rev 2015; 1(1): 27-33. doi: 10.13040/IJPSR.0975-8232.IJLSR.1(1).27-33.
All © 2015 are reserved by International Journal of Life Sciences and Review. This Journal licensed under a Creative Commons Attribution-NonCommercial-ShareAlike 3.0 Unported License.
Article Information
6
27-33
829
2442
English
IJLSR
V. P. Patil *, S. S. Angadi, S. H. Kale, S. D. Shelke, S. T. Kawade and R. L. Kadam
Department of Pharmaceutical Analysis, Yash Institute of Pharmacy, Aurangabad, Maharashtra, India.
vandana2609@gmail.com
23 July 2014
28 October 2014
04 December 2014
http://dx.doi.org/10.13040/IJPSR.0975-8232.IJLSR.1(1).27-33
01 January 2015