


SUSTAIN RELEASE FORMULATION AND EVALUATION OF CIPROFLOXACIN SUSTAIN RELEASE TABLET AND ITS COMPARISON WITH MARKET PRODUCT
HTML Full TextSUSTAIN RELEASE FORMULATION, AND EVALUATION OF CIPROFLOXACIN SUSTAIN RELEASE TABLET AND ITS COMPARISON WITH MARKET PRODUCT
Md. Shozan Mondal * 1, Sharif Md. Abuzar 1, Md. Ariful Islam 2, Md. Tauhidul Islam 1 and Md. Sharifur Rahman 1
Department of Pharmacy 1, University of Asia Pacific, Dhanmondi, Dhaka - 1209, Bangladesh.
BRAC University 2, 66 Mohakhali, Dhaka - 1212, Bangladesh.
ABSTRACT: In this study, an attempt was made to design and evaluate oral sustained release matrix tablets of ciprofloxacin using methocel K4M CR, HPMC 15 cps, avicel PH 101 as the retardant polymer. Tablets were prepared by conventional wet granulation technique. Tablets were evaluated for parameters such as weight variation, hardness, friability, and drug content. All the formulations showed compliance with pharmacopeial standards. In vitro release studies were performed using USP type II apparatus (paddle method) in 900 ml of 0.1N HCl at 50 rpm for 8 h. The release kinetics was analyzed using the zero-order, first order, Higuchi, Hixson-Crowell, and Korsmeyer-Peppas equations to explore and explain the mechanism of drug release from the matrix tablets. In vitro release studies revealed that percent drug release decreased with increase of polymer loading. Based on the dissolution data comparison with innovator brand F-5 formulation (16% Methocel K4M CR w/w of drug) was elected as the best formulation. The drug release profile of the best formulation was well controlled and uniform throughout the dissolution studies.
Keywords: Sustain release, Ciprofloxacin HCl, Formulation and Evaluation, In-vitro release study, Drug release kinetics
INTRODUCTION: In the last two decades, sustained-release dosage forms have made significant progress in terms of clinical efficacy and patient compliance 1. Conventional tablets are the most popular and available oral solid formulations that are preferred by physicians and patients 2. But conventional tablet formulations are not ideally suited to some drugs having high solubility in low pH and short plasma half-life 3.
The goal of any drug delivery system is to provide a therapeutic amount of drug to the proper site in the body to achieve the desired drug concentration. That is, the drug-delivery system should deliver the drug at a rate dictated by the needs of the body throughout treatment 4. This idealized objective points to the two aspects most important to drug delivery, namely, spatial placement and temporal delivery of a drug. Spatial placement relates to targeting a drug to a specific organ or tissue, while temporal delivery refers to controlling the rate of drug delivery to the target tissue 5.
The bulk of research has been directed at oral dosage forms that satisfy the temporal aspect of drug delivery, but many of the newer approaches under investigation may allow for spatial placement as well as 6, 7. Modern drugs are rarely administered in pure chemical form. Rather, they are prepared in a vehicle called a drug delivery system 8. Thus, depending on the route of administration and therapeutic objectives, the drug delivery systems can be categorized as 9-
A) Conventional Drug Delivery Systems:
- Solids
- Liquids
- Semisolids
B) Controlled-Release Drug Delivery Systems:
- Sustained release
- Prolonged release
- Pulse-release
- Constant release
C) Novel Drug Delivery Systems:
- Targeted
- Self-regulated
- Biofeedback
- Biological carriers
Most conventional dosage forms function merely to place a drug at the site of administration and pay no regard to the regulation of release and absorption or the duration and targeting of drug in the body 10. With many drugs, the basic goal of therapy to achieve a steady-state blood level or tissue level that is therapeutically effective and nontoxic for an extended period. The design of proper dosage regimens is an important element in accomplishing this goal. A basic objective in dosage form design is to optimize the delivery of medication to achieve a measure of control of the therapeutic effect in the face of the uncertain fluctuations in the in-vivo environment in which drug release takes place 11.
So nowadays one of the most active areas of research and development in drug delivery involves -controlled release products rather than develop new drug entities at great cost; as some drug therapies already on the market can be improved simply by controlling the rate at which they enter the bloodstream. The oral route is the route most often used for administration of drugs. Tablets are the most popular oral formulations available in the market and are preferred by patients and physicians alike 12. In long term therapy for the treatment of chronic disease conditions, conventional formulations are required to be administered in multiple doses and therefore, have several disadvantages. Controlled release (CR) tablet formulations are preferred for such therapy because they offer better patient compliance, maintain uniform drug levels, reduce dose and side effects, and increase the safety margin for high-potency drugs 13.
Joseph R. Robinson has claimed in the book ‘Sustained and controlled release drug delivery systems, “Drug delivery must be continued at a rate such that the condition in question is cured or controlled in minimum time with the fewest side effects. Thus, an appropriate definition of controlled drug release is as follows: It is the phasing of drug administration to the needs of the condition at hand so that an optimal amount of drug is used to cure or control the condition in a minimum time 14.
In some situations, this might mean that drug is delivered more promptly for short periods, and in other cases, it would mean prolongation of drug levels. In the latter category we employ the terms ‘sustained release‘ and ‘prolonged-release‘ interchangeably this designates only one aspect of controlled release, namely, to produce protracted levels of the drug in the body” 15, 16, 17.
MATERIALS AND METHODS:
TABLE 1: REAGENTS AND SOLVENTS USED, WHICH WERE USED IN THE EXPERIMENT ARE AS FOLLOWS:
| S. no. | Name | Source |
| 1 | Ciprofloxacin HCl | Incepta Pharmaceuticals Limited, Bangladesh |
| 2 | Methocel K15 M CR | Incepta Pharmaceuticals Limited, Bangladesh |
| 3 | Avicel PH 101 | Veer Pharma Chem, Ahmedabad, India |
| 4 | Magnesium Stearate | Chemical Management Co. Germany |
| 5 | Hydrochloric acid | Merck, Germany. |
| 6 | HPMC 15 CPS | Eskayef Bangladesh Ltd. |
| 7 | Purified Talc | Wilfrid Smith Ltd, UK |
Methodology:
Preparation of Sustained Release Granules: For tablet preparation, we have to make the sustain release granules. Ciprofloxacin hydrochloride, HPMC 15 CPS, Mithocel K 15 M CR & Lactose has been used to make granules.
TABLE 2: LIST OF APPARATUS USED IN THIS EXPERIMENT ARE AS FOLLOWS
| S. no. | Name | Source | Country of origin |
| 1 | Electronic Balance | Shimadzu Corporation | Japan |
| 2 | Single Punch Compression Machine | Manesty | England |
| 3 | Tablet Dissolution Appararus | Veego | Japan |
| 4 | UV-Vis Spectrophotometer | Shimadzu | Japan |
| 5 | PH meter | Eutech Instrument | Singapore |
| 6 | Digital Veneer Caliper | SDK | China |
| 7 | Sonicator | Hwashin Technology | Korea |
TABLE 3: COMPOSITION OF SUSTAINED RELEASE GRANULES
| S. no. | Ingredients (mg/tablet) | Sustained release granules 1 | Sustained release granules 2 |
| 1 | Ciprofloxacin Hydrochloride | 2.5 gm | 2.5 gm |
| 2 | HPMC 15 CPS | 2 gm | - |
| 3 | Mithocel K 15 MCR | - | 2 gm |
| 4 | Lactose | 0.5 | 0.5 |
Evaluation of Granules:
Bulk Density: LBD (Loose bulk density) and TBD (Tapped bulk density) were determined by placing 2 g of powder from each formula (previously lightly shaken to break any agglomerates formed) into a 10-ml measuring cylinder. After the initial volume was observed, the cylinder was allowed to fall under its weight onto a hard surface from the height of 2.5 cm at 2-second intervals. The reading of tapping was continued until no further change in volume was noted. Using the following equation, LBD and TBD was calculated:
LBD = Weight of the powder/volume of the packing
TBD = Weight of the powder/Tapping volume of the packing
Compressibility Index: The compressibility index of the granules was determined by Carr‘s compressibility index:
Carr‘s index (%) = {(TBD – LBD) × 100}/ TBD
The Angle of Repose: The angle of repose is the maximum angle that can be obtained between the freestanding surface of a powder heap and the horizontal plane. Such a measurement gives a qualitative assessment of the internal cohesive and frictional effects under low levels of external loading, as might in powder mixing, or tablet die or capsule shell filling operations. It was measured by fixed funnel and freestanding cone method as reported by Raghuram et al., Accurately weighed powders of each formulation (excluding talc and magnesium stearate) were carefully poured through the funnel stationed on a clamp with its tip at 2 cm height, H from the base, until the apex of the conical heap so formed just reached the tip of the funnel. The mean diameter, 2R, of the base of the powder cone was measured, and the angle of repose (θ) was calculated using the following equation:
Tan θ = H/R
TABLE 4: U.S PHARMACOPOEIA HAS CLASSIFIED FLOW PROPERTIES OF POWDER BASED ON ANGLE OF REPOSE
| Flow property | Angle of repose (degree) |
| Excellent | 25-30 |
| Good | 31-35 |
| Fair-aid not needed | 36-40 |
| Passable-may hang up | 41-45 |
| Poor- must agitate, vibrate | 46-55 |
| Very poor | 56-65 |
| Very, very poor | >66 |
The values for the angle of repose were found to range from 30ο-35ο. This indicates fairly good flow properties of powders, through the feed hopper into the die cavity of the tablet punch machine. However, it is advisable to use glidants and lubricants to facilitate its passage through the hopper without any hindrance.
Studies of Bulk and Tapped Densities: The US Pharmacopoeia (USP) makes the following comments on powder density: “The bulk density often is the bulk density of the powder ‘as poured’ or as passively filled into a measuring vessel. The tapped density is a limiting density attained after ‘tapping down’ usually in a device that lifts and drops a volumetric measuring cylinder containing the powder a fixed distance”. Both poured (or fluff) bulk (Dο) and tapped densities (Df) was determined using a tensiometer, using USP-2 method.
Accurately weighed powders from each formulation, previously lightly shaken to break any agglomerates formed, were introduced into a 10 ml measuring cylinder. After the initial volume, Va was recorded, the initial tappings of 500 taps were allowed to begin.
After an initial of 500 taps, the volume, Vb, was noted. Then after, the second round of tapping of 750 taps started. The volume, Vf was again noted. If the difference between the last two volumes was equal or greater than 2%, then a final tapping of 1250 times was allowed until the difference remained less than 2%. Bulk and tapped densities were estimated using the following formula:
Bulk density= M/ Va
Tapped density= M/Vf
Where, Va= poured volume Vf= final volume after tapping M= mass of the powder blend
Preparation of Sustain Release Tablet: For the preparation of tablet, we sieve the excipients and active material and make the granules and dry it by the oven. Then compressed the granules by single punch machine. After that, we got the double-layered tablet. In this research work, the drug release pattern from various formulations (based on hydrophilic matrix system) was observed to identify the probability of certain hydrophilic polymer as sustaining agents for drug release. With a view to this, 5 probable formulations were designed. Here ciprofloxacin was taken as a model drug.
Formulation:
TABLE 5: COMPOSITION OF IMMEDIATE LAYER
| S. no. | Ingredients | Amount (mg/tablet) |
| 1 | Ciprofloxacin hydrochloride | 2.5 gm
|
| 2 | Avicel PH 101 | 2 gm |
TABLE 6: COMPOSITION OF SUSTAINED LAYER
| S. no. | Ingredients (mg/tablet) | F1 | F2 |
| 1 | Ciprofloxacin hydrochloride | 2.5 gm
|
2.5 gm
|
| 2 | HPMC 15 CPS | 2 gm | - |
| 3 | Mithocel K 15 M CR | - | 2 gm |
| 4 | Lactose | 0.5 | 0.5 |
TABLE 7: DIFFERENT TYPES OF FORMULATIONS USING DIFFERENT TYPES OF POLYMERS
| Granules | F1 | F2 | F3 | F4 | F5 |
| Immediate release | 450 | 450 | 450 | 450 | 450 |
| HPMC 15 CPS | 516 | - | 258 | 172 | 344 |
| Mithocel K 15 M CR | -
|
516 | 258 | 344 | 172 |
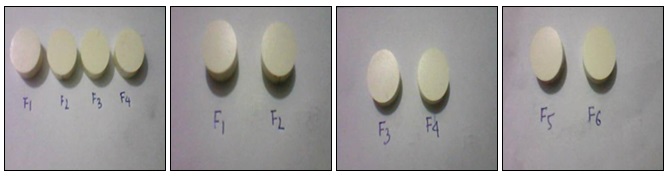
FIG. 1: DIFFERENT TYPES OF DIFFERENT FORMULATED TABLETS OF F1, F2, F3, F4 AND F5
For the preparation of tablet, we sieve the excipients and active material and make the granules and dry it by the oven. Then compressed the granules by single punch machine. After that, we got the double-layered tablet.
Measurement of Some Physical Parameters Matrix Tablets: The tablets of each formulation were tested for certain physical parameters, e.g. hardness and tensile strength, thickness, diameter, friability, etc. Before compression of the tablets, the powders were examined for their angle of repose to gather knowledge about the flow properties of the powder.
Thickness Measurement: Five tablets of each of the formulations were taken, and thickness was measured by digital Vernier Caliper. The values were reported in millimeter (mm). Mean was calculated.
Diameter Measurement: Similarly, six tablets of each of the formulations were taken, and their diameters were measured by Vernier Caliper. The values were reported in millimeter (mm). Mean was calculated.
The Average Weight of the Dosage Unit: 10 tablets of each formulation were weighed using an electronic balance. Weight values were reported in mg. Mean values were calculated.
Preparation of Dissolution Media: After preparation a tablet then we prepare a dissolution media. Dissolution media was 0.1 N HCl, PH was 1.2.
In-vitro Dissolution Test:
In-vitro Release Studies: For dissolution simulated gastric medium (pH 1.2) prepared by mixing 8.6 ml of hydrochloric acid (37% w/v) with sufficient water to produce 1000 ml was used. The release rates of ciprofloxacin sustain release tablet was determined using US FDA Dissolution Guideline. Dissolution Testing Apparatus was apparatus 2 (paddle method). The dissolution test was performed using 900 ml medium at 37 ±0.5 °C and 50 rpm. The medium was preheated to 37 °C, added to the vessels and was allowed to equilibrate for 15 min. Six tablets from each formulation were weighed and placed in the baskets. The operation was carried out for 8 h. After every 2 h, 10 ml of sample solution was withdrawn and filtered. The released drug was assayed by using UV spectrophotometer (Shimadzu, Model UV-160A, Kyoto, Japan) at 276 nm after suitable dilution. The amount of drug present in the samples was calculated from calibration curves constructed from the standard solution of the reference standard.
Drug Release Kinetics: To study the release kinetics, data obtained from in vitro drug release study were tested with the following mathematical model.
Zero-Order Equation: The equation assumes that the cumulative amount of drug release is directly related to time. The equation may be as follows:
C = K0 t........................................................ (1)
Where, K0 is the zero order rate constant expressed in unit concentration/time, and t is the time an hour. A graph of concentration vs. time would yield a straight line with a slope equal to K0 and intercept the origin of the axes.
First Order Equation: The release behaviour of first-order equation is expressed as the log cumulative percentage of drug remaining vs. time. The equation may be as follows (Wagner, 1969):
Log C = Log C0 - kt / 2.303.............................. (2)
Where, C = The amount of drug un-dissolved at t time, C0 = Drug concentration at t =0, k = Corresponding release rate constant.
Higuchi Square Root Law: The Higuchi release model describes the cumulative percentage of drug release vs. square root of time. The equation may be as follows (Higuchi, 1961):
Q = K√t........................................................... (3)
Where, Q = the amount of drug dissolved at time t. K is the constant reflecting the design variables of the system. Hence, the drug release rate is proportional to the reciprocal of the square root of time.
Hixson-Crowell Cube Root Law: It is the law that represents the idea about the evaluation of drug release pattern changes with the surface area and the diameter of the particles/tablets (Hixon et al., 1931). It is mentioned as the cube root of the percentage of drug remaining in the matrix vs. time. The equation may be as follows
Q0 1/3 – Qt 1/3 = kHC х t.................................... (4)
Where Q0 = Initial amount of the drug in the tablets. Qt = the amount of drug release in time ‘t.’ kHC = The rate constant for the Hixson-Crowell cube root law.
Korsmeyer–Peppas Equation: Korsmeyer et al., developed a simple, semi-empirical model relating exponentially the drug release to the elapsed time. The equation may be as follows:
Q/Q0 = Ktn ...................................................... (5)
Where Q/Q0 = The fraction of drug released at time‗t‘. k = Constant comprising the structural geometric characteristics. N = The diffusion exponent that depends on the release mechanism.
If n≤0.5, the release mechanism follows a Fickian diffusion, and if 0.5<n<1, the release follows a non-Fickian diffusion or anomalous transport (Peppas, 1985). The drug release follows zero order drug release and case II transport if n=1. But when n>1, then the release mechanism is super case II transport. This model is used in the polymeric dosage form when the release mechanism is unknown or more than one release phenomena is present in the preparation.
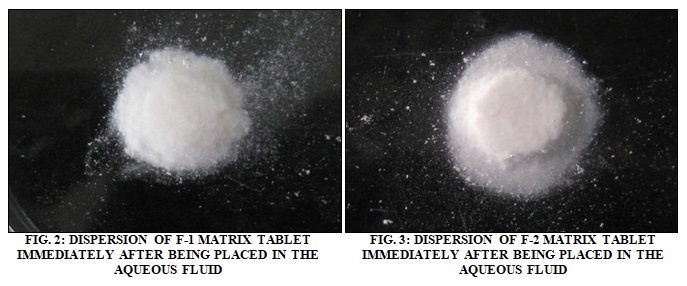
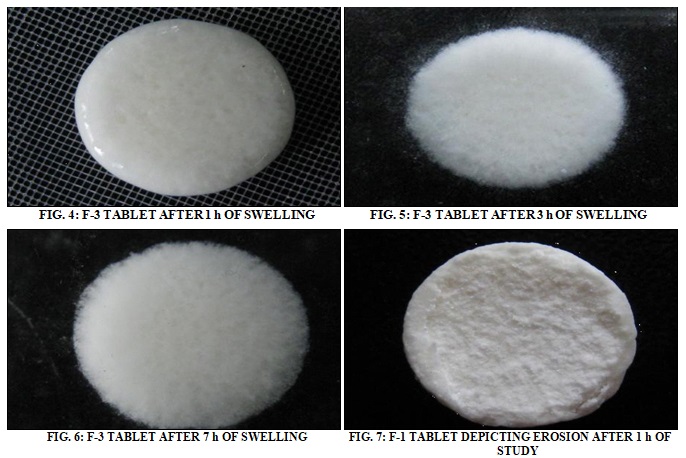
Swelling Index: Tablets composed of polymeric matrices form a gel layer around the tablet core when they come in contact with water. This gel layer governs the drug release. The kinetics of swelling is important because the gel barrier is formed by water penetration. Swelling indices of tablets of each formulation were determined at the time intervals of 1, 3, and 7 h. 3 tablets of each formulation were initially weighed and carefully placed on Petri dishes, labelled 1, 3 and 7 respectively, all containing pH 6.8 phosphate buffers. The temperature is maintained at about 37°C. At every assigned time intervals, the tablets were removed from the Petri dishes, the surface liquid was carefully removed by tissue paper and reweighed to assess weight gain of the swollen tablets. Swelling index for each tablet is then determined by using the formula:
% Swelling = S/R × 100
Where, S= weight of the matrix after swelling, R= weight of the eroded tablet
The visual demonstration of the swelling process of the different formulations at different times of the investigation aid to get a proper understanding of the process.
Initial Weight:
- 900 mg
- 910 mg
- 933 mg
- 892 mg
Weight after Swelling:
S 1 =1.130 gm
S 3 = 1.296 gm
S 7= 1.300 gm
Weight of Eroded Tablet:
R 1= 0.905 gm
R 3= 0.977 gm
% swelling = S/R × 100
= 124.862 (after 1 h)
=132.650 (after 3 h)
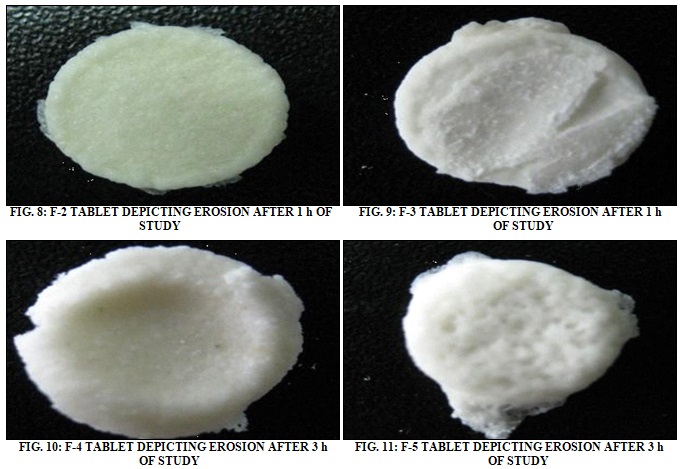
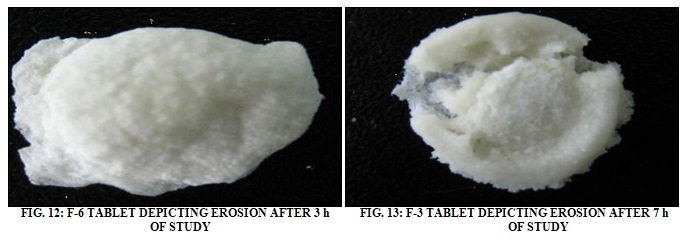
Erosion Index: Similarly, the erosion indices of the tablets of each formulation were determined in the above set up, only this time the tablets were dried in a vacuum oven at 40°C for 2.5 h and reweighed after drying. Erosion index is calculated using the formula:
% erosion= (T-R/T) × 100
Where, T= initial weight of the tablet, R=weight of the eroded tablet
The visual demonstrations of erosion of polymer matrix observed in different formulations during different times of the investigation are provided as follows.
RESULTS AND DISCUSSION:
Characterization of Granules: The granules of different proposed formulations (F-1 to F-5) were evaluated for LBD, TBD, compressibility index, and angle of repose Table 8. The results of LBD ranged from 0.200 to 0.620 g/cm3 and TBD ranged from 0.313 to 0.911 g/cm3 respectively. The bulk densities of granules of the proposed formulation were quite higher than those of other granules. This may be due to the presence of more fine granules.
TABLE 8: PHYSICAL PROPERTIES OF GRANULES
| Parameters
|
Starch
|
Avicel pH 101 | Lactose
|
HPMC 15 cps | Talc
|
Mg.
Stearate |
Methocel K 15 MCR |
| LBD (g/cm3) | 0.456 | 0.361 | 0.620 | 0.440 | 0.510 | 0.200 | 0.300 |
| TBD (g/cm3) | 0.589 | 0.451 | 0.721 | 0.564 | 0.911 | 0.313 | 0.469 |
| Compresibility Index % | 22.5 | 20 | 14 | 22 | 44 | 36 | 36 |
| Angle of Repose | 33.69 | 45 | 48.01 | 33.69 | 37.56 | 37.56 | 35.53 |
The results of compressibility index (%) ranged from 14 to 44 generally, compressibility index values up to 15% result in good to excellent flow properties. So the granules showed good flow properties than other granules. The results of the angle of repose ranged from 33 to 48. The results of the angle of repose (<30) indicate good flow properties of granules, which was supported the results found from compressibility index. All these results indicate that the granules possessed satisfactory flow properties and compressibility.
Physicochemical Evaluation of Matrix Tablets: The results of physical parameters (weight, hardness, thickness, and friability) and drug content of the prepared matrix tablets are shown in this study. The thickness of the tablets was found between 5.42 mm to 5.23, the hardness of the tablets ranged from 382 N to 379 N and diameter 13.02 mm to 12.82 mm.
The weight variations of prepared tablets complied with the pharmacopoeial specifications. The drug content of every formulation was found about 100% of the labelled content. So it can be said that physical properties and drug content of the compressed matrix tablets were satisfactory.
TABLE 9: COMPARISON OF HAUSNER RATIO AND COMPRESSIBILITY INDEX (IN PERCENT) OF DIFFERENT FORMULATIONS
| Comparison of Hausner Ratio and Compressibility Index (in percent) of Different Formulations | ||
| Material | Hausner Ratio | Compressibility Index (in percent) |
| Starch | 1.290 | 22.5 |
| Avicel pH 101 | 1.250 | 20 |
| Lactose | 1.163 | 14 |
| HPMC 15 cps | 1.282 | 22 |
| Talc | 1.786 | 44 |
| Mg Stearate | 1.563 | 36 |
| Methocel K 15 MCR | 1.563 | 36 |
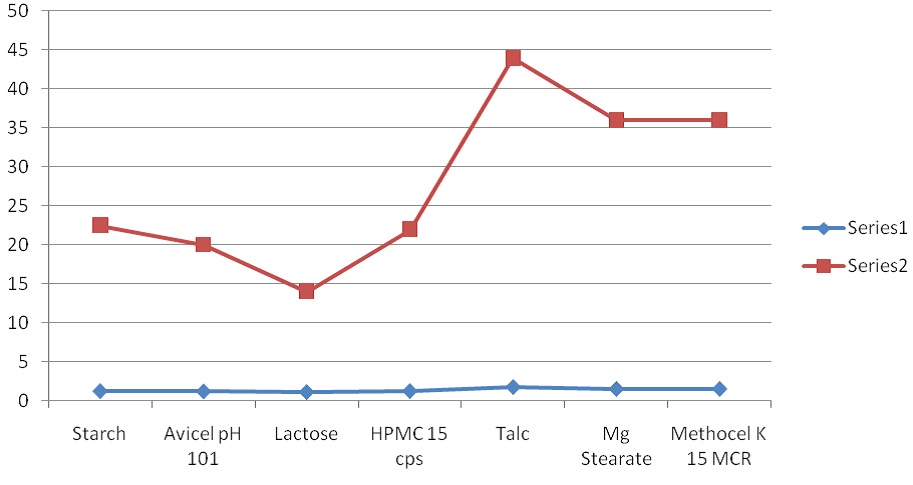
FIG. 14: COMPARISON OF HAUSNER RATIO AND COMPRESSIBILITY INDEX (IN PERCENT) OF DIFFERENT FORMULATIONS
TABLE 10: COMPARISON OF BULK DENSITY (gm/cm3) AND COMPRESSIBILITY INDEX (IN PERCENT) OF DIFFERENT FORMULATIONS
| Comparison of Bulk Density (gm/cm3) and Compressibility Index (in percent) of Different Formulations | ||
| Material | Bulk Density | Compressibility Index (in percent) |
| Starch | 0.456 | 22.5 |
| Avicel pH 101 | 0.361 | 20 |
| Lactose | 0.620 | 14 |
| HPMC 15 cps | 0.440 | 22 |
| Talc | 0.510 | 44 |
| Mg Stearate | 0.200 | 36 |
| Methocel K 15 MCR | 0.300 | 36 |
TABLE 11: PREPARATION OF CIPROFLOXACIN STANDARD CURVE
| Conc.(mcg/ml) | Absorbance |
| 0 | 0.000 |
| 1 | 0.129 |
| 2 | 0.258 |
| 3 | 0.387 |
| 4 | 0.516 |
| 5 | 0.645 |
| 6 | 0.774 |
| 7 | 0.903 |
| 8 | 1.032 |
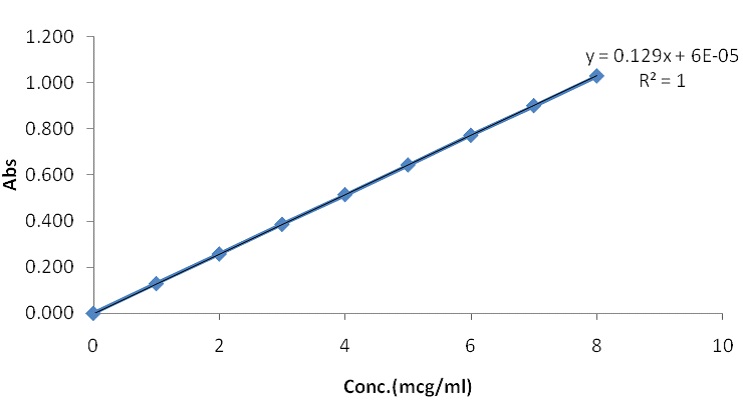
FIG. 15: CIPROFLOXACIN STANDARD CURVE
Dissolution Study of Market Product: First of all, I have studied market products of different pharmaceutical companies. I have collected the ciprofloxacin 1000 mg sustain release tablet and shown the dissolution profile. I have shown the % release of different brands. I observed the release is 71% at 7 h. To compare the release pattern, I studied the innovator brand of ciprofloxacin tablet. The % release is about 100 % at 2 h, but the tablet was 500 mg.
TABLE 12: DISSOLUTION PROFILE (% RELEASE) OF BRAND PRODUCT A, B & C
| % Release | |||
| Time (min) | A | B | C |
| 0 | 0 | 0 | 0 |
| 15 | 2.675 | 1.7 | 2.1875 |
| 30 | 4.55 | 3.7 | 4.125 |
| 60 | 9.75 | 10.955 | 10.3525 |
| 90 | 11.985 | 16.415 | 14.2 |
| 120 | 19.675 | 21.445 | 20.56 |
| 180 | 26.075 | 31.46 | 28.7675 |
| 240 | 35.78 | 38.125 | 36.9525 |
| 300 | 44.63 | 59.365 | 51.9975 |
| 360 | 49.645 | 61.125 | 55.385 |
| 420 | 71.600 | 68.545 | 70.0725 |
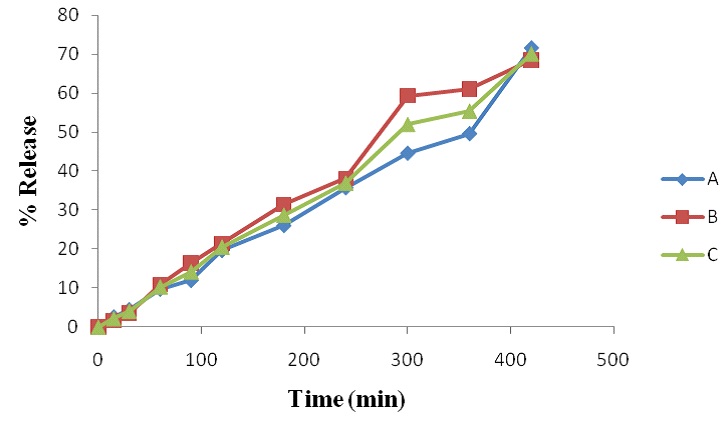
FIG. 16: DISSOLUTION PROFILE (% RELEASE) OF BRAND PRODUCT A, B & C
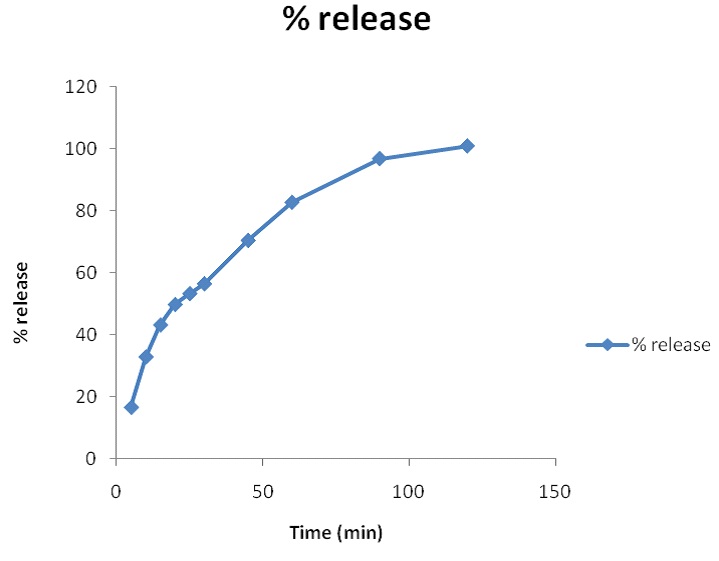
FIG. 17: DISSOLUTION PROFILE OF INNOVATOR BRAND
TABLE 13: DISSOLUTION PROFILE OF INNOVATOR BRAND
| Time (min) | % release |
| 5 | 16.6 |
| 10 | 32.9 |
| 15 | 43.2 |
| 20 | 49.8 |
| 25 | 53.3 |
| 30 | 56.5 |
| 45 | 70.5 |
| 60 | 82.8 |
| 90 | 96.9 |
| 120 | 101 |
Dissolution Study of New Formulation: Finally, I have prepared 5 different formulations by using different polymers with ciprofloxacin for comparison with the market product (dissolution profile).
TABLE 14: DISSOLUTION STUDY FOR DIFFERENT FOMULATION (% DRUG RELEASE)
| Time (min) | F1 | F2 | F3 | F4 | F5 |
| 0 | 0 | 0 | 0 | 0 | 0 |
| 15 | 5.065116279 | 10.213953 | 4.2 | 3.516279 | 4.339534884 |
| 30 | 5.902790698 | 10.369302 | 7.73503876 | 12.68093 | 9.145891473 |
| 60 | 11.60496124 | 30.227442 | 26.9227907 | 12.38884 | 20.66093023 |
| 90 | 19.92325581 | 29.723566 | 39.49953488 | 24.45473 | 36.3772093 |
| 120 | 32.00232558 | 51.396434 | 52.49178295 | 55.56016 | 58.12604651 |
| 180 | 71.7848062 | 51.425581 | 61.66992248 | 61.5738 | 59.69178295 |
| 240 | 72.9275969 | 58.984496 | 66.02170543 | 61.68605 | 66.23875969 |
| 300 | 74.98914729 | 58.728682 | 67.55193798 | 61.10078 | 69.37674419 |
| 360 | 78.6496124 | 56.80155 | 68.95813953 | 67.62636 | 87.72093023 |
| 420 | 84.02635659 | 58.379845 | 68.5627907 | 68.9938 | 85.2372093 |
| 480 | 82.18139535 | 59.142636 | 74.06511628 | 74.64031 | 89.13023256 |
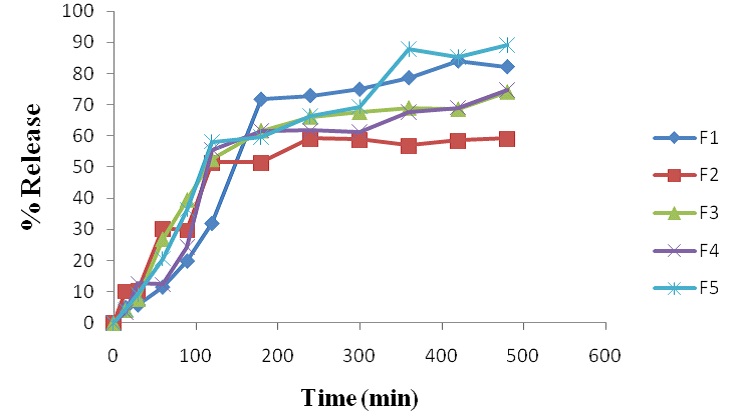
FIG. 18: DRUG RELEASE FROM DIFFERENT FORMULATIONS (F-1 TO F-5)
In-vitro Release Study: The release profiles of different formulations (F-1 to F-5) of ciprofloxacin matrix tablets. All dissolution data are based on the actual drug content of the test tablets as calculated from the assay results. As per the results of dissolution study formulations F1, F2, F3, F4, F5, showed 82%, 59%, 74%, 74% and 89%, drug release in 8 h respectively. This showed that the drug release from the tablet was sustained for 8 hr. Drug release decreased with an increase of polymer loading as HPMC 15 cps polymers form a viscous gelatinous layer (gel layer) upon exposure to the aqueous medium by undergoing rapid hydration and chain relaxation and this gel layer acts as the barrier to release of drug and as a result drug release are prolonged.
TABLE 15: Y-EQUATION (Y = aX+b) AND CORRELATION CO-EFFICIENT (R2) FROM DIFFERENT PLOTS OF FORMULATION F-1 TO F-5
| Formula | Zero Order Y equation | R2 | 1st order Y equation | R2 | Higuchi Model Y equation | R2 | Hixson-Crowell Model Y equation | R2 |
| F1 | y = 11.70x + 7.600 | R² =
0.859 |
y = -0.110x + 1.994 | R² =
0.915 |
y = 36.87x - 12.65 | R² =
0.905 |
y = 0.434x + 1.719 | R² =
0.719 |
| F2 | y = 6.811x + 17.90 | R² =
0.711 |
y = -0.048x + 1.908 | R² =
0.758 |
y = 23.20x + 3.376 | R² =
0.876 |
y = 0.297x + 2.168 | R² =
0.494 |
| F3 | y = 8.923x + 16.36 | R² =
0.775 |
y = -0.072x + 1.923 | R² =
0.866 |
y = 29.72x - 1.604 | R² =
0.913 |
y = 0.36x + 2.035 | R² =
0.569 |
| F4 | y = 9.251x + 12.53 | R² =
0.799 |
y = -0.073x + 1.947 | R² =
0.872 |
y = 30.05x - 4.916 | R² =
0.896 |
y = 0.375x + 1.897 | R² =
0.620 |
| F5 | y = 11.29x + 12.83 | R² =
0.879 |
y = -0.123x + 1.991 | R² =
0.955 |
y = 36.08x - 7.507 | R² =
0.953 |
y = 0.403x + 1.965 | R² =
0.650 |
Drug Release Kinetics: The data from Table 15 shows that most of the formulations of all the formulations were found to follow the 1st order and Higuchi release model. F-1 was best fitted in terms of 1st order release kinetics (R² = 0.915), F-2, F-3, F-4 follows Higuchi model (R² = 0.876), (R² = 0.913), (R² = 0.896) respectively. F-5 follows 1st order release R² = 0.955).
CONCLUSION: The present study was undertaken to design oral sustained-release tablets of ciprofloxacin. It can be concluded that the present study indicates that the oral sustained-release tablets of ciprofloxacin provide a better option for therapy. The success of the in-vitro drug release studies recommends the product for further in vivo studies. We can see that from dissolution data, the release pattern of ciprofloxacin is much better than market product ciprofloxacin sustain release. So if we can manufacture ciprofloxacin sustain release tablet by using new formulation (F1, F2, F3, F4, F5), we will get a good result than an existing market product.
ACKNOWLEDGEMENT: I would like to take the opportunity to express my honor and profound gratitude to A.S.M. Ashraful Islam, Associate Professor, Department of Pharmacy, University of Asia Pacific, my thesis supervisor, from the core of my heart for his keen supervision and goal oriented guidance throughout my whole thesis Work. I am grateful to all the respective teachers of the Department of Pharmacy, University of Asia Pacific, for their uninterrupted dedication, motivation, the drive that has pushed us forward against all hindrances, their affection, guidance, and companionship that have provided us at all times. I also give my special thanks to the management of Incepta Pharmaceutical Bangladesh Ltd for providing Active Ingredients & excipients.
CONFLICT OF INTEREST: Nil
REFERENCES:
- Bidada J, Gonjari I, Bhusari A, Raut C and Dhule A: Development of extended release matrix tablets of ciprofloxacin containing polyacrylic and ethyl cellulose polymers. Der Pharmacia Lettre 2011; 3 (4): 215-226.
- Cameron CG and McGinity JW: Controlled release theophylline tablet formulations containing acrylic resins, II. Combination resin formulations. Drug Dev Ind Pharm 1987; 13: 1409-1427.
- Cartensen JT: Drug Stability: Principle and Practices. Marcel Dakker, New Work, Edition 2nd, 1995: 538-550.
- European Agency for the Evaluation of Medicinal Products (EMEA) Notes for Guidance on the Investigation of Bioavailability and Bioequivalence 2001. Available at http://www.emea.europa.eu/pdfs/human./ewp/140198en.pdf.
- Higuchi T: Rate of release of medicaments from ointment bases containing drugs in suspension. J Pharm Sci 1961; 50: 847-875.
- Hixon AW and Crowell JH: Dependence of reaction velocity upon surface and agitation. Ind Eng Chem 1931; 23: 923-931.
- Korsmeyers RW, Gumy R, Doelker EM, Buri P and Peppas NA: Mechanism of solute release from porous hydrophilic polymers. Int J Pharm 1983; 15: 25-35.
- Lordi N: Sustained release dosage forms. In: Lachman, L., Lieberman, H.A., Kanig, J.L. (Eds.), The theory and practice of Industrial Pharmacy. Lea and Febiger, Philadelphia, 1986; 430-478.
- Peppas NA: Analysis of Fickian and non-Fickain drug release from polymers. Pharm Acta Hel 1985; 60: 110-111.
- Perez-Marcos B, Ford JL, Amstrong DJ, Elliott PNC, Rostron C and Hogan JW: Release of propranolol hydrochloride from matrix tablets containing hydroxyl propyl methyl cellulose K4M and Carbopol 974. Int J Pharm 1994; 111: 251-259.
- Priya RM, Natarajan R and Rajendran NN: Design and in- vitro evaluation of sustained release tablets of ciprofloxacin. Int J Pharm Sci Res 2011; 2(3): 922-928.
- Rahman MM, Jha MK, Ahsan QM and Begum T: Effect of various grades of hydroxypropyl methylcellulose matrix systems as oral sustained release drug delivery systems for ciprofloxacin. J of Pharm and Cosmetol 2011; 1(2): 81-92.
- US Food and Drug Administration, Center for Drug Evaluation and Research. Guidance for industry: Dissolution testing of immediate release solid oral dosage forms 1997. Available at: http://www.fda.gov/cder/ Guidance/ 1713bp1.pdf.
- Uddin NM, Ahmed I, Amin MR, Islam RM, Rahman HM and Jalil R: In-vitro release kinetics study of ranolazine from swellable hydrophilic matrix tablets. Dhaka Univ J Pharm Sci 2009; 8(1): 31-38.
- Vergnaud JM: Controlled drug release from oral dosage forms. Ellis Horwood Limited, London 1993.
- Wagner JG: Interpretation of present dissolved-time plots derived from in-vitro testing of conventional tablets and capsules. J Pharm Sci 1969; 58: 1253-1257.
- The United States Pharmacopeia: 27, NF 25. United States Pharmacopoeial Convention Inc, Rockville, MD.20852, U.S.A. 2007; 1756.
How to cite this article:
Mondal MS, Abuzar S M, Islam MA, Islam MT and Rahman MS: Sustain release formulation and evaluation of ciprofloxacin sustain release tablet and its comparison with market product. Int J Life Sci & Rev 2015; 1(4) 124-136. doi: 10.13040/IJPSR.0975-8232.IJLSR.1(4).124-136.
All © 2015 are reserved by International Journal of Life Sciences and Review. This Journal licensed under a Creative Commons Attribution-NonCommercial-ShareAlike 3.0 Unported License.
Article Information
4
124-136
1,112
2087
English
IJLSR
M. S. Mondal*, S. M. Abuzar, M. A. Islam, M. T. Islam and M. S. Rahman
Department of Pharmacy, University of Asia Pacific, Dhanmondi, Dhaka, Bangladesh
shozan_uap15@yahoo.com
25 January 2015
17 March 2015
28 March 2015
10.13040/IJPSR.0975-8232.IJLSR.1(4).124-136
01 April 2015