


QUANTITATIVE STRUCTURE-TOXICITY RELATIONSHIP (QSTR) STUDY OF POLYCHLORINATED DIBENZOFURANS USING QUANTUM CHEMICAL DESCRIPTORS
HTML Full TextQUANTITATIVE STRUCTURE-TOXICITY RELATIONSHIP (QSTR) STUDY OF POLYCHLORINATED DIBENZOFURANS USING QUANTUM CHEMICAL DESCRIPTORS
Sabitu Babatunde Olasupo * 1, Adamu Uzairu 2 and Balarabe Sagagi 1
Department of Chemistry 1, Kano University of Science and Technology, Wudil Kano, Nigeria.
Department of Chemistry 2, Ahmadu Bello University Zaria, Nigeria.
ABSTRACT: One of the important aspects of modern toxicology research is the prediction of toxicity of environmental pollutants from their molecular structure A Quantitative Structure Toxicity Relationship (QSTR) study was applied to a dataset of 35 polychlorinated dibenzofurans (PCDFs) to investigate the relationship between toxicities of the compounds and their structures. The molecular descriptors were obtained by Density Functional Theory (DFT) (B3LYP/6-31G*) level of calculation. The QSTR model was built using Genetic Function Algorithm (GFA) method. The model with the best statistical significance (N = 24, Friedman LOF = 0.361, R2 = 0.963, R2adj. = 0.955 R2cv = 0.889, R2pred= 0.8286, P95% ˂ 0.05) was selected. The accuracy of the model was evaluated through Leave one out (LOOV) cross-validation, external validation using test set molecules, Y-randomization, and applicability domain techniques. The prediction results are expected to be useful in predicting and identify structural features responsible for the toxicity of the chemicals and other congeneric compounds that fall within the model’s applicability domain.
Keywords: GFA, DFT, PCDFs, QSTR, Toxicity, Descriptors
INTRODUCTION: A quantitative risk assessment becomes increasingly important in modern society and is slowly incorporated into the legislation of different countries. For instance, the European Union (EU) has introduced the Registration, Evaluation, and Authorization of Chemicals (REACH) program for assessment of the human and environmental risk of all chemicals that are produced or imported in the amount greater than 1 ton per year.
One of the important aspects of modern toxicology research is the prediction of toxicity of environmental pollutants from their molecular structure. The potential toxicity of compounds could be assessed based on a wide variety of physicochemical and biological properties 1. These physicochemical and biological properties of molecules constitute their molecular descriptors.
Polychlorinated dibenzofurans (PCDFs) are polychlorinated aromatic compounds that represent a group of environmental contaminants known by their ubiquitous distribution, resistance to biological and chemical degradation, high toxicity, and bioaccumulation 2. They can have a significant impact on the health and well-being of human and animals 2. Some of the health effects at long exposure to these compounds include liver enlargement and lesions, immune-toxicity, a wasting syndrome, spleen atrophy, carcinogenesis, endocrine disruption, and extreme cases, death 3. In addition to these, several persistent organic pollutants (e.g., PCDFs) are suspected of contributing to the increasing prevalence and risk of type 2 diabetes 4. Polychlorinated dibenzofurans (PCDFs) are mainly formed or produced from as by-products of various industrial processes and incomplete combustion of wastes such as medical or municipal wastes incineration, including burning of many materials that contain chlorine and polychlorinated chemicals 5, 6.
Quantitative structure activities relationship (QSAR/QSTR) as an important area of chemometrics has been the subject of a series of investigations 7. In order to ensure a safer environments and quicker estimation of the environmental behaviours of PCDFs, quantitative structure-toxicity relationship (QSTR) models, which correlate and predict toxicity data of compounds from their molecular structural descriptors have been developed over the years, providing valuable approach in research into the toxicity of compounds without necessarily embarking on the conventional laborious, time-consuming and expensive experiments. QSTR has been widely applied to evaluate and predict the toxicity of chemicals 8. Previous studies have shown that reliable QSTR models are not only applied to predict the toxicity and provide basic data to risk assessment but also used to explain the toxicity mechanisms 9.
The alternative hypothesis of this study includes:
The magnitude of the observed toxicity log (1/EC50) of Polychlorinated dibenzofurans (PCDFs) is a direct function of the empirical property (ies) or the theoretical parameter(s) which makes the descriptor of the total chemical structure of the compounds under investigation.
The null hypothesis to this research includes;
The observed toxicity log (1/EC50) of Polychlorinated dibenzofurans (PCDFs) is independent of the descriptors of their total chemical structures. This study aims to build robust and rational Genetic function approximation (GFA) based QSTR models on predicting the toxicity of Polychlorinated dibenzofurans (PCDFs) by exploring the correlations between the experimental log (1/EC50) of the compounds and their calculated molecular descriptors. It is envisaged that the information in this study would provide a fast, economical, more environmentally friendly and less time-consuming techniques of accessing the toxicity of Polychlorinated dibenzofurans (PCDFs) and other related toxic Polychlorinated aromatic chemicals and Organic pollutants that could endanger our environment.
MATERIALS AND METHODS: The materials used in this study include; Dell® computer system (Intel Pentium), 4.80 GHz processor, 8GB RAM size on Microsoft Windows 7 Ultimate operating system, Spartan 14 V.1.1.0, Chem Draw Ultra 12.0.V, Padel descriptor tool kit and Microsoft office Excel 2013 version, Material Studio (modeling and simulation software) version 7.0, and Dataset Division GUI v 1.2 software. The various steps invoked for the QSTR study are presented in the flowchart in Fig. 1.
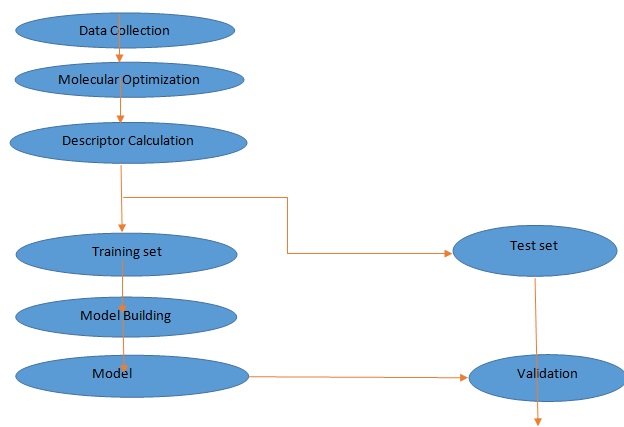
FIG. 1: STEPS INVOKED IN THE QSAR STUDY
Data collection: A data set of Polychlorinated dibenzofurans (35 PCDFs) used for the QSTR analysis was selected from the literature 10. The Chemical structures and experimental log (1/EC50) values for studied compounds are represented in Table 1.
TABLE 1: CHEMICAL STRUCTURES AND EXPERIMENTAL LOG (1/EC50) VALUES OF (PCDFS)
| S/N. | IUPAC name/Chemical structure | TOXICITY log (1/EC50) |
| 1 | 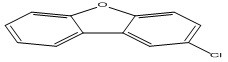
2-Chlorodibenzofuran |
3.55 |
| 2 | 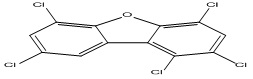
1,2,4,6,8-Pentachlorodibenzofuran |
5.51 |
| 3 | 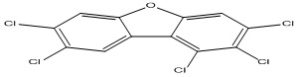
1,2,3,7,8-Pentachlorodibenzofuran |
7.13 |
| 4 | 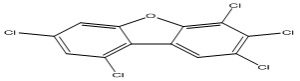
2,3,4,7,9-Pentachlorodibenzofuran |
6.70 |
| 5 | 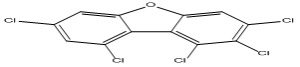
1,2,3,7,9-Pentachlorodibenzofuran |
6.40 |
| 6 | 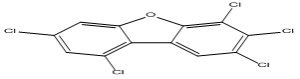
2,3,4,7,9-Pentachlorodibenzofuran |
6.70 |
| 7 | 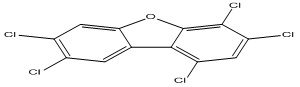
1,3,4,7,8-Pentachlorodibenzofuran |
6.70 |
| 8 | 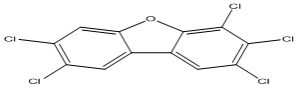
2,3,4,7,8-Pentachlorodibenzofuran |
7.82 |
| 9 | 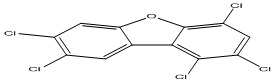
1,2,4,7,8-Pentachlorodibenzofuran |
5.89 |
| 10 | 
1,2,3,7,8-Pentachlorodibenzofuran |
7.13 |
| 11 | 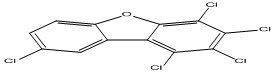
1,2,3,4,8-Pentachlorodibenzofuran |
6.92 |
| 12 | 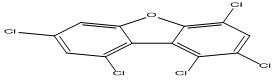
1,2,4,7,9-Pentachlorodibenzofuran |
4.70 |
| 13 | 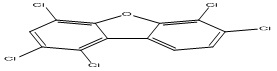
1,2,4,6,7-Pentachlorodibenzofuran |
7.17 |
| 14 | 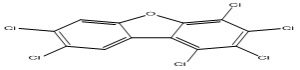
1,2,3,4,7,8-Hexachlorodibenzofuran |
6.64 |
| 15 | 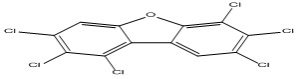
1,2,3,6,7,8-Hexachlorodibenzofuran |
6.57 |
| 16 | 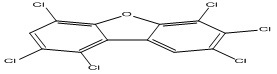
1,2,4,6,7,8-Hexachlorodibenzofuran |
5.08 |
| 17 | 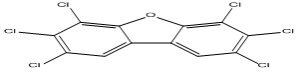
2,3,4,6,7,8-Hexachlorodibenzofuran |
7.33 |
| 18 | 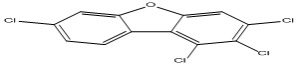
1,2,3,7-Tetrachlorodibenzofuran |
6.96 |
| 19 | 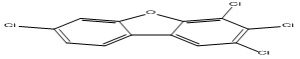
2,3,4,7-Tetrachlorodibenzofuran |
7.60 |
| 20 | 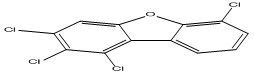
1,2,3,6-Tetrachlorodibenzofuran |
6.46 |
| 21 | 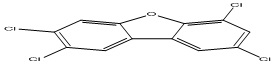
2,3,6,8-Tetrachlorodibenzofuran |
6.66 |
| 22 | 
1,2,4,8-Tetrachlorodibenzofuran |
5.00 |
| 23 | 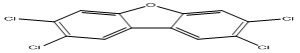
2,3,7,8-Tetrachlorodibenzofuran |
7.39 |
| 24 | 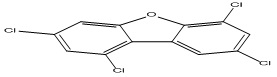
1,3,6,8-Tetrachlorodibenzofuran |
6.66 |
| 25 | 
2,3,4,8-Tetrachlorodibenzofuran |
6.70 |
| 26 | 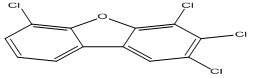
2,3,4,6-Tetrachlorodibenzofuran |
6.46 |
| 27 | 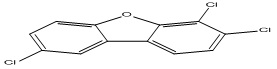
2,6,7-Trichlorodibenzofuran |
6.35 |
| 28 | 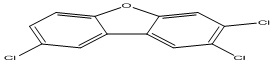
2,3,8-Trichlorodibenzofuran |
6.00 |
| 29 | 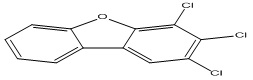
2,3,4-Trichlorodibenzofuran |
4.72 |
| 30 | 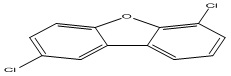
2,6-Dichlorodibenzofuran |
3.61 |
| 31 | 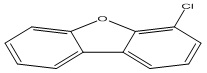
4-Chlorodibenzofuran |
3.00 |
| 32 | 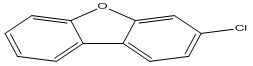
3-Chlorodibenzofuran |
4.38 |
| 33 | 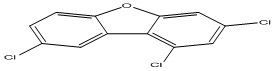
1,3,8-Trichlorodibenzofuran |
4.07 |
| 34 | 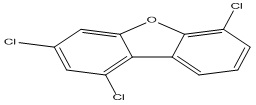
1,3,6-Trichlorodibenzofuran |
5.36 |
| 35 | 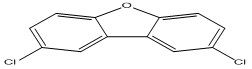
2,8-Dichlorodibenzofuran |
3.59 |
Molecular Optimization and Descriptors Calculation: Optimization is the process of finding the equilibrium or lowest energy geometry of molecules. The chemical structure of each compound was drawn with Chem Draw ultra version 11 12.02 module of the program and subsequently imported into Wave function program Spartan ‘’14’’ version 12 1.2.2 for structural minimization. The geometries of all the compounds (35 PCDFs) were optimized using Density functional theory (DFT) using the B3LYP level of theory and 6-31G* as the basis set. The molecular descriptors were calculated by using paDel descriptor tool kit and Spartan “14” software. The most significant descriptors were identified using the Genetic Function Approximation (GFA) algorithm. Molecular descriptors simply refer to arithmetical values that describe properties of molecules obtained from a well-defined algorithm or experimental procedure 13. The various 0D, 1D, 2D, and 3D descriptors were calculated.
Data set division into training and test set: The training set comprises of molecules used in model development while the test set is made up of molecules not used in building the model that is used in the external validation of the model, i.e. evaluation of its prediction abilities. Dataset Division GUI v 1.2 software was used to divide the data set of the studied compounds into a training set of 24 PCDFs (70%) and a prediction set (test set) of 11 PCDFs (30%) respectively.
Genetic function algorithm and model building: In this study, a statistical technique of analysis by Genetic function approximation algorithm was employed to build the models. Genetic function approximation (GFA) algorithm is a search method to find exact or approximation solution to optimization and search problems, which is based on the principles of Darwinian evolution 14. A peculiar feature of Genetic function approximation (GFA) algorithm is that it generates a population of equations rather than a single equation as do most other statistical methods. The range of variations in this population gives added information on the quality of fit and importance of the descriptors 15. The fitness function or Lack of Fit (LOF) used to estimate the quality of the model here was the leave one out gross validated correlation coefficient (Q2LOO) and is calculated by equation 2.1.
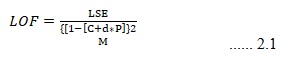
Where c is the number of basic functions, d is the smoothing parameter, M is the number of samples in the training set, LSE is the least square error and P is the number of features contained in all basis functions 16.
Validation of the Developed Model: The predictive ability of the developed QSTR model was evaluated using both internal and external statistical validation parameters. The validation parameters were compared with the minimum recommended value for a generally acceptable QSAR/QSTR model proposed by Ravichandran et al. 17 shown in Table 2.
TABLE 2: VALIDATION PARAMETERS FOR A GENERALLY ACCEPTABLE QSAR MODEL
| S/N | Symbol | Name | Range |
| 1 | R2 | Coefficient of determination | ≥ 0.6 |
| 2 | Q2 | Gross validation coefficient | > 0.5 |
| 3 | R2 pred. | Coefficient of determination for external test set | ≥ 0.6 |
| 4 | R2 adj | Adjusted square correlation coefficient | > 0.5 |
| 5 | P (95%) | Confidence interval at 95% | ≤ 0.05 |
| 6 | Next test set | Minimum number of extending test set | ≥ 5 |
| 7 | R2 – Q2 | Difference between R2 and Q2 | ≤ 0.3 |
Applicability Domain (AD): The model was further validated by applying the Williams plot, the plot of the standardized residuals versus the leverage, as shown in Fig. 2. This was exploited to visualize the applicability domain (AD) 8. (Leverage indicates a compound’s distance from the centroid of X. The leverage of a compound in the original space is defined as;
![]()
Where xi is the descriptor vector of the considered compound and X is the descriptor matrix derived from the training set descriptor values.
The warning leverage (h*) is defined as:
![]()
Where n = number of training compounds, p= number of predictor variables.
QSAR RESULTS:
TABLE 3: MODELS GENERATED BY GFA
| S/N | Equation | Definition |
| 1 | Y = 67.283 * X273
+ 30.319* X388 + 71.368 * X646 - 31.859 * X850 - 62.577 |
X273 : MATS2e
X388 : SpDiam_Dzv X646 : SHBa X850 : XLogP |
| 2 | Y = 70.468* X273
+ 70.901 * X646 + 27.833 * X810 - 25.951 * X850 - 65.761 |
X273 :MATS2e
X646 : SHBa X810 : SpDiam_D X850 :XLogP |
| 3 | Y = 12.864* X55
+ 55.475 * X68 + 44.384 * X273 - 21.059 * X665 - 46.498 |
X55 : BD : ATS5i
X68 : AATS0m X273 : MATS2e X665 : maxwHBa |
| 4 | Y = 404.661* X109
+ 49.204 * X273 + 415.328* X431 - 17.126 * X665 - 442.707 |
X109 : DF : AATS5i
X273 : MATS2e X431 : SM1_Dzi X665 : maxwHBa |
| 5 | Y = 39.983631205 * X97
+ 4.055892341 * X235 + 43.096234880 * X273 - 19.022551018 * X665 - 33.547 |
X97 : AATS2p
X235 :AATSC5i X273 : MATS2e X665 : maxwHBa |
TABLE 4: STATISTICAL PARAMETERS OF THE BEST MODEL
| Model | R2 | R2adj | F-Value | R2cv | Friedman LOF |
| 1 | 0.963 | 0.955 | 122.008 | 0.889 | 0.361 |
Based on statistical significance, model 1 is chosen as the best model
TABLE 5: A BRIEF DESCRIPTION OF THE SELECTED DESCRIPTORS OF THE BEST MODEL-1
| Descriptor | Regression coefficient | Description | Descriptor Class |
| MATS2e | 67.283 | Moran autocorrelation - lag 2 / weighted by Sanderson electronegativities | Autocorrelation Descriptor
|
| SpDiam_Dzv
|
30.319 | Spectral diameter from Barysz matrix / weighted by van der Waals volumes | Barysz Matrix Descriptor |
| SHBa | 71.368 | Sum of E-States for (strong) hydrogen bond acceptors | Electro topological State Atom Type Descriptor |
| XLogP | -31.859 | XLogP | XLogP Descriptor |
TABLE 6: COMPARISON OF EXPERIMENTAL LOG (1/EC50) AND PREDICTED LOG (1/EC50) OF TRAINING SET MOLECULES BY MODEL 1
| S/N | Chemical
Names |
Experimental
log (1/EC50) |
Predicted log (1/EC50) | Residual
log (1/EC50) |
| 1 | 1,2,4,6,8-Pentachlorodibenzofuran | 5.510 | 5.273 | 0.237 |
| 2 | 1,2,3,7,9-Pentachlorodibenzofuran | 6.400 | 6.265 | 0.135 |
| 3 | 2,3,4,7,9-Pentachlorodibenzofuran | 6.700 | 7.077 | -0.377 |
| 4 | 1,3,4,7,8-Pentachlorodibenzofuran | 6.700 | 6.984 | -0.284 |
| 5 | 2,3,4,7,8-Pentachlorodibenzofuran | 7.820 | 7.988 | -0.168 |
| 6 | 1,2,3,7,8-Pentachlorodibenzofuran | 7.130 | 7.176 | -0.046 |
| 7 | 1,2,3,4,8-Pentachlorodibenzofuran | 6.920 | 6.658 | 0.262 |
| 8 | 1,2,4,7,9-Pentachlorodibenzofuran | 4.700 | 4.706 | -0.006 |
| 9 | 1,2,3,4,7,8-Hexachlorodibenzofuran | 6.640 | 6.359 | 0.281 |
| 10 | 1,2,3,6,7,8-Hexachlorodibenzofuran | 6.570 | 6.409 | 0.161 |
| 11 | 1,2,4,6,7,8-Hexachlorodibenzofuran | 5.080 | 5.396 | -0.316 |
| 12 | 2,3,4,6,7,8-Hexachlorodibenzofuran | 7.330 | 7.251 | 0.079 |
| 13 | 1,2,3,7-Tetrachlorodibenzofuran | 6.960 | 6.922 | 0.038 |
| 14 | 2,3,4,7-Tetrachlorodibenzofuran | 7.600 | 7.744 | -0.144 |
| 15 | 1,2,3,6-Tetrachlorodibenzofuran | 6.46 | 6.429 | 0.030 |
| 16 | 2,3,6,8-Tetrachlorodibenzofuran | 6.660 | 6.483 | 0.177 |
| 17 | 2,3,7,8-Tetrachlorodibenzofuran | 7.390 | 7.384 | 0.006 |
| 18 | 2,3,4,8-Tetrachlorodibenzofuran | 6.700 | 6.833 | -0.133 |
| 19 | 2,6,7-Trichlorodibenzofuran | 6.350 | 5.788 | 0.562 |
| 20 | 2,3,4-Trichlorodibenzofuran | 4.720 | 4.793 | -0.073 |
| 21 | 4-Chlorodibenzofuran | 3.000 | 3.336 | -0.336 |
| 22 | 3-Chlorodibenzofuran | 4.380 | 3.909 | 0.470 |
| 23 | 1,3,8-Trichlorodibenzofuran | 4.070 | 4.518 | -0.448 |
| 24 | 2,8-Dichlorodibenzofuran | 3.590 | 3.697 | -0.107 |
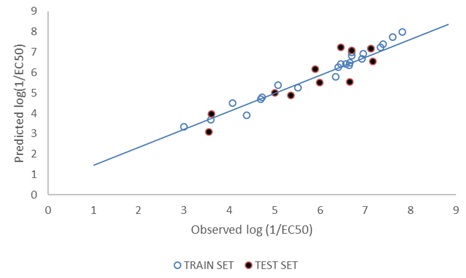
FIG. 2: PLOT OF PREDICTED (TRAINING & TEST SETS) vs. THE OBSERVED LOG (1/EC50) VALUES
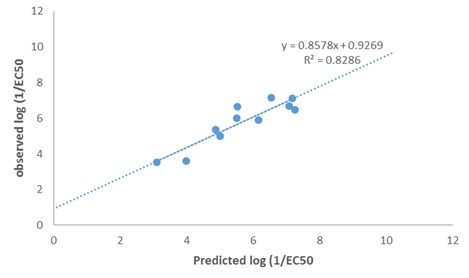
FIG. 3: SCATTERED PLOT OF THE EXPERIMENTAL AND PREDICTED LOG (1/EC50) TEST SET MOLECULES
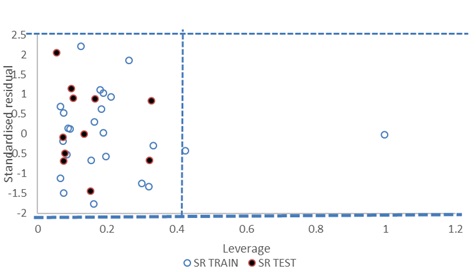
FIG. 4: WILLIAMS PLOT OF MODEL 1
TABLE 7: THE RESULTS OF Y-RANDOMIZATION OF THE TRAINING SET
| Model | R | R^2 | Q^2 |
| Random 1 | 0.7141 | 0.510 | -1.793 |
| Random 2 | 0.465 | 0.216 | -1.129 |
| Random 3 | 0.375 | 0.140 | -30.571 |
| Random 4 | 0.313 | 0.098 | -21.643 |
| Random 5 | 0.210 | 0.044 | -46.378 |
TABLE 8: RANDOM MODELS PARAMETERS
| Average R : | 0.370 |
| Average R^2 : | 0.162 |
| Average Q^2 : | -16.107 |
| cRp^2 : | 0.633 |
DISCUSSION: Model 1 gives the best GFA derived QSTR model for predict the p1/EC50 of PCDFs. The result of the GFA QSTR model is in conformity with the standard shown in Table 2 as N = 24, Friedman LOF = 0.361, R2 = 0.963, R2adj. = 0.955 R2cv = 0.889, R2pred= 0.8286, P95% ˂ 0.05. This confirms the robustness of the model. Fig. 2 reveals the agreement between the experimental and the predicted values of p1/EC50 of molecules in the test set. The high Linearity of this plot indicates a sound agreement between the experimental and predicted values indicative of the high internal accuracy of the model. Likewise, Fig. 3 gives a combined plot of the experimental and the predicted values of p1/EC50 training and test set molecules.
The high linearity of the plot is indicative of an excellent external predictive power of the model. The comparison of experimental and predicted p1/EC50 of the compounds is presented in Table 6. The predictability of model 1 is evidenced by the low residual values observed in the Table. The P-value of the optimization model at 95% confidence level shown has α value ˂0.05. This reveals that the alternative hypothesis that the magnitude of the observed toxicity of PCDFs is a direct function of the descriptors of their total chemical structures takes preference over the null hypothesis, which states otherwise. The statistical significance of the relationship between the toxicity of PCDFs and their molecular descriptors was further demonstrated by Y-randomization procedure. The results of Y-randomization test, as well as the random model's parameters, are shown in Tables 7 and 8, respectively. The low R2 and Q2 values obtained shows that the optimization model is robust and was not obtained due to a chance correlation. The fact that the value of cR2p of the model is > 0.5, as reported in Table 8 is a good confirmation that the model is robust and very reliable 18.
Since, the model 1 cannot predict the toxicity of all compounds in the universe, its applicability domain was determined using William’s plot shown in Fig. 4. All the compound in the test set falls inside the domain of the GFA model (the warning leverage h* =0.40). There are only two compounds in the training set which have the leverage higher than the warning h* value as shown in the plot, thus they can be regarded as structural outliers. This implies that the models can be successfully applied to this series of Polychlorinated dibenzofurans. The few compounds with higher leverage than h* are most likely to be structural outliers.
Significance of the Descriptors in the Model 1: The positive coefficient of the descriptors; MATS2e, SpDiam_Dzv, SHBa reveal that the toxicity of PCDFs increases with an increase in the values of these descriptors. Thus, the higher the values of these descriptors in a PCDFs, the more the toxicity of the molecule and vice versa. Also, the negative coefficient of XLogP descriptor as an indication that the value of this descriptor in PCDFs varies inversely with its toxicity. The percentage contribution of each descriptor in the model include; 33.50% (MATS2e), 15.1% (SpDiam_ Dzv), 35.5% (SHBa), 15.9% (XLogP). Judging from the percentage contribution of each descriptor in the model, MATS2e and SHBa descriptors were found to predominantly influence the observed toxicity of PCDFs. MATS2e (Moran auto-correlation / weighted by Sanderson electro-negativities) is a descriptor of electro-negativity of the molecules. Its positive coefficient in the model reveals that the toxicity of PCDFs varies directly with the value of this descriptor in the molecule. This is consonance with the findings of Emilia et al. (2011) 19 in which the observed toxicity of aromatic nitro-derivatives was influenced by a descriptor of molecular electro-negativity, X1.
SpDiam_Dzv (Spectral diameter from Barysz matrix weighted by van der Waals volumes) is a descriptor of molecular size. Its positive coefficient in the model reveals that the toxicity of PCDFs varies directly with the value of this descriptor in the molecule. This is an agreement with the findings Falandysz et al. (2001) 20 in which van der Waal's volume (size descriptor) of dioxins has a pronounced influence on the observed toxicity of the molecules. Also in agreement is the result of the QSTR modelling by Hassan et al. (2016) 21 in which ETA-dAlpha-B (a measure of electronic features of the molecules relative to molecular size) was found to influence the toxicity of the studied dioxins. The increase in toxicity with an increase in molecular size may be due to the possibility of the molecule been largely confined to the plasma compartment because of their too large size affecting its distribution via out the body.
XLogP is a descriptor of lipophilicity of molecules. Its negative coefficient in the model is an indication that the value of this descriptor varies inversely with the toxicity of the molecules and vice versa. SHBa (Sum of E-States for (strong) hydrogen bond acceptors), just as the name implies it is a descriptor of hydrogen bond acceptor ability of a molecule. Its positive coefficient in the model reveals that the toxicity of PCDFs varies directly with the value of this descriptor in the molecule. This is in agreement with the findings of Lipinski et al. (2001) 22 and van de et al. (2003) 23. The increase in toxicity of PCDFs with an increase in values of hydrogen bond acceptor descriptors may be due to the possibility of this descriptor eliciting some interaction of the toxic molecules with biological macromolecules such as enzymes or cellular receptors.
CONCLUSION: In this study, QSTR modeling for the toxicity of Polychlorinated dibenzofurans (35 PCDFs) to explore the structural features that are responsible for its toxicity was successfully performed using Genetic Function Approximation (GFA) approach at the B3LYP level of theory and 6-31G* as a basis set. The observed log (1/EC50) of the Polychlorinated dibenzofurans (PCDFs) was found to be predominantly influenced by MATS2e, SpDiam_Dzv, SHBa, and XLogP descriptors. The robustness, reliability, stability and applicability of the QSTR models was established by internal and external validation techniques (N = 24, Friedman LOF = 0.361, R2 = 0.963, R2adj. = 0.955 R2cv = 0.889, R2pred= 0.8286, P95% ˂ 0.05.). It is believed that the information in this model will provide a fast, economical and more environmentally friendly techniques of assessing the toxicity of Polychlorinated dibenzofurans (PCDFs) and other related Polychlorinated aromatic toxic chemicals/ pollutants which are being constantly released into our environment owing to ever increasing industrial activities and incomplete combustion of various processes such as medical and domestic wastes incineration.
ACKNOWLEDGEMENT: The authors appreciate the support from Mrs. Olasupo Rasheedat Titilayo. We also acknowledge the valuable assistance of Mr. David Ebuka Arthur, Samuel Hassan, Philip Ameji, and Pharm. Olaniran Olakunle Daniel.
CONFLICT OF INTEREST: There are no conflicts of interest.
REFERENCES:
- Basak SC, Grunwald GD, Gute BD, Balasubramanian K and Opitz D: J Chem Inf Comput Sci 2013; 40: 885.
- Tysklind M, Lundgreen K, Rappe C, Eriksson L and Jonsson M: Environ Toxicol Chem 2013; 12: 659.
- Safe S, Safe L and Mullin M: Polychlorinated Biphenyls (PCBs): Springer-Verlag: Berlin 2015: 1.
- Ohura T, Morita M, Kuruto-Niwa R, Amagai T, Sakakibara H and Shimo K: Environ Toxicol 2010; 25: 180.
- Chu S, Zheng M and Xu X: Characterization of the combustion products of polyethylene. Chemosphere 2015; 39: 1497-1512
- Hay SM and Aylward LL: Dioxin risks in perspective: post, present and future. Reg Toxico Pharmacol 2015; 37: 202-17.
- Li FX, Liu C, Zhang L, Liping Y, Zhao J and Wu H: Environmental Toxicol And Pharmacol 2016; 32: 278-85.
- Netzeva TI, Worth AP, Aldenberg T, Benigni R, Cronin MTD, Gramatica P, Jaworska JS, Kahn S, Klopman G, Marchant CA, Myatt G, Nikolova-Jeliazkova N, Patlewicz GY,Perkins R, Roberts DW, Schultz TW, Stanton DT, van de Sandt JJM, Tong WD, Veith G and Yang CH: Current status of methods for defining the applicability domain of (quantitative) structure-activity relationships-The report and recommendations of ECVAM Workshop 52. Atla-Alternatives to Laboratory Animals 2015, 33: 155-173.
- Ashek, Lee C, Park H and Cho SJ: 3D QSAR studies of dioxins and dioxin-like compounds using CoMFA and CoMSIA Chemosphere 2013; 65: 521-529.
- Mekenyan OG, Veith DJ and Ankley GTA: QSAR evaluation of Ah receptor bonding of halogenated aromatic Exnobiotics. Environ Health Perspect 2013; 104: 1302-10.
- CS Chem3D Ultra Cambridge soft corporation, Cambridge USA, 2014.
- WAREFUNCTION, Inc. Spartai 14 version 1.1.2, Irvine, California, USA. 2013.
- Ameji JP, Uzairu A and Idris SO: J Comput Methods Mol Des 2015; 5 120.
- Holland J: University of Michigan Press, Adaptation in Natural and Artificial systems, 1975/1992.
- Wu W, Zhang C, ling W, Chen Q, Guo X and Qian Y: Plos One 2015; 10: 3.
- Kunal R, Roy PP, Paul S and Mitra I: Molecules 2009; 14: 1660-1701.
- Ravichandran V, Rajak H, Jain A, Sivadasan S, Varghese CP and Kishore-Agrawal P: Int J of Design and Discovery 2011; 2: 511-519.
- Ambure P, Aher RB, Gajewicz A, Puzyn T and Roy K: Chemometrics and Intelligent Laboratory Systems 2015; 147: 1-13.
- Amzoiu E, Anoaica PG, Lepădatu CI: Revue Roumaine De Chimie 2011; 56(7): 711-716.
- Falandysz J, Puzyn T, Szymanowska B, Kawano M, Markuszewski M, Kaliszan R, Skurski P, Błażejowski J and Wakimoto T: Thermodynamic and physico-chemical descriptors of chloronaphthalenes: an attempt to select features explaining environmental behaviour and specific toxic effects of these compounds. Polish Journal of Environmental Studies 2001; 10 (4): 217-235.
- Samuel H, Uzairu A, Mamza PA and Joshua OO: Genetic functional algorithm prediction of toxicity of some polychlorinated dioxins using dft and semi-empirical calculated molecular descriptors. International Journal of Pharma Sciences and Research 2016, 7(3): 114-125
- Lipinski CA, Lombardo F, Dominy BW and Feeney PJ: Experimental and computational approaches to estimate solubility and permeability in drug discovery and development settings. Adv Drug Del Rev 2001; 46: 3-26.
- Van de Waterbeemd H and Gifford E: ADMET in-silico modeling: towards prediction paradise? Nat Rev Drug Discov 2003; 2: 192-204.
How to cite this article:
Olasupo SB, Uzairu A and Sagagi B: Quantitative structure-toxicity relationship (QSTR) study of polychlorinated dibenzofurans using quantum chemical descriptors. Int J Life Sci & Rev 2016; 2(12): 175-86. doi: 10.13040/IJPSR.0975-8232.IJLSR.2(12).175-86.
All © 2015 are reserved by International Journal of Life Sciences and Review. This Journal licensed under a Creative Commons Attribution-NonCommercial-ShareAlike 3.0 Unported License.
Article Information
2
175-186
838
1437
English
IJLSR
S. B. Olasupo * , A. Uzairu and B. Sagagi
Department of Chemistry, Kano University of Science and Technology, Wudil Kano, Nigeria
olasabit@yahoo.com
20 August 2016
15 November 2016
11 December 2016
10.13040/IJPSR.0975-8232.IJLSR.2(12).175-86
31 December 2016